

 Login
Login

 March 11, 2026
|
Voiced by Amazon Polly |
Introduction
In modern cloud environments, maintaining storage performance is essential for reliable applications and a smooth user experience. Problems such as slow file access, latency spikes, or storage bottlenecks can directly impact application availability and business operations. Amazon EFS integrated with Amazon CloudWatch provides real-time visibility into storage behavior by monitoring key KPIs, such as throughput, IOPS, I/O size, client activity, and storage usage. This continuous insight helps teams quickly identify performance issues, optimize configurations, reduce unnecessary costs, and maintain consistent, high-performing applications.
Pioneers in Cloud Consulting & Migration Services
- Reduced infrastructural costs
- Accelerated application deployment
Overview
Amazon Elastic File System (EFS) is a fully managed, scalable, and POSIX-compliant shared file storage service that automatically scales as workloads grow. While Amazon EFS simplifies storage management, continuous monitoring is required to ensure optimal performance and efficiency. Amazon CloudWatch collects real-time Amazon EFS metrics such as TotalIOBytes, ReadIOBytes, WriteIOBytes, and MetadataIOBytes, which are used to calculate important KPIs, including throughput, IOPS, and average I/O size. These insights enable better workload analysis, proactive troubleshooting, capacity planning, and performance optimization across your storage environment.
Step-by-Step Implementation
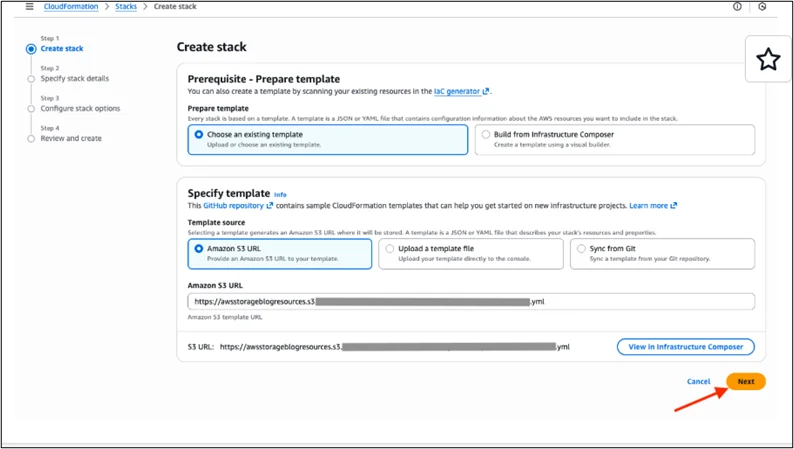
Step 1: Access AWS CloudFormation
Sign in to the AWS Management Console and open the AWS CloudFormation service.
Choose the region where your Amazon EFS file system is deployed to ensure the dashboard collects accurate metrics.
AWS CloudFormation template for creating an Amazon CloudWatch Dashboard to monitor Amazon EFS KPIs such as Throughput, IOPS, IO Size, Client Connections, and Storage Bytes.
|
1 2 3 4 5 6 7 8 9 10 11 12 13 14 15 16 17 18 19 20 21 22 23 24 25 26 27 28 29 30 31 32 33 34 35 36 37 38 39 40 41 42 43 44 45 46 47 48 49 50 51 52 53 54 55 56 57 58 59 60 61 62 63 64 65 |
AWSTemplateFormatVersion: '2010-09-09' Description: Compact CloudWatch Dashboard for Amazon EFS Monitoring Parameters: DashboardName: Type: String FileSystemId: Type: String Resources: EFSDashboard: Type: AWS::CloudWatch::Dashboard Properties: DashboardName: !Ref DashboardName DashboardBody: !Sub | { "widgets": [ { "type":"metric","x":0,"y":0,"width":12,"height":6, "properties":{ "title":"Throughput", "metrics":[ ["AWS/EFS","TotalIOBytes","FileSystemId","${FileSystemId}"], [".","ReadIOBytes",".","."], [".","WriteIOBytes",".","."] ], "region":"${AWS::Region}" } }, { "type":"metric","x":12,"y":0,"width":12,"height":6, "properties":{ "title":"IOPS", "metrics":[ ["AWS/EFS","DataReadIOBytes","FileSystemId","${FileSystemId}",{"stat":"SampleCount"}], [".","DataWriteIOBytes",".",".",{"stat":"SampleCount"}] ], "region":"${AWS::Region}" } }, { "type":"metric","x":0,"y":6,"width":12,"height":6, "properties":{ "title":"Client Connections", "metrics":[ ["AWS/EFS","ClientConnections","FileSystemId","${FileSystemId}"] ], "region":"${AWS::Region}" } }, { "type":"metric","x":12,"y":6,"width":12,"height":6, "properties":{ "title":"Storage Bytes", "stacked":true, "metrics":[ ["AWS/EFS","StorageBytes","FileSystemId","${FileSystemId}","StorageClass","Standard"], [".",".",".",".",".","InfrequentAccess"] ], "region":"${AWS::Region}" } } ] } Outputs: DashboardURL: Value: !Sub https://${AWS::Region}.console.aws.amazon.com/cloudwatch/home?region=${AWS::Region}#dashboards:name=${DashboardName} |
Use the AWS CloudFormation Template
Upload and use the AWS CloudFormation template to create an Amazon CloudWatch dashboard.
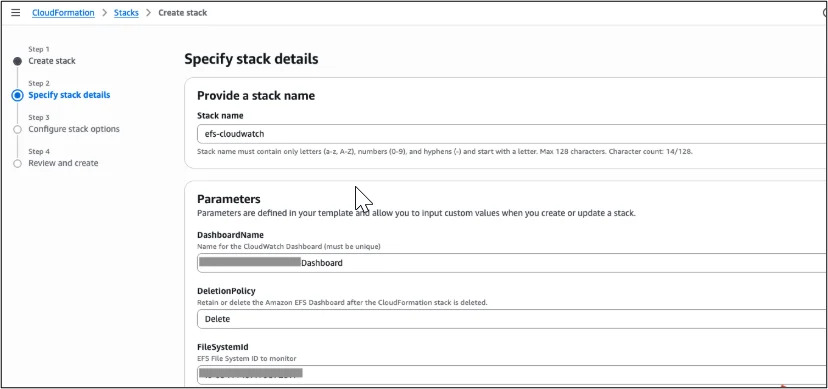
Step 2: Create a New Stack
Choose the option to create a new AWS CloudFormation stack and load the template provided for Amazon EFS monitoring. This template automatically builds a CloudWatch dashboard that calculates and visualizes key performance metrics.
During this step, you must provide:
- Stack Name (example: efs-monitoring-dashboard)
- Amazon CloudWatch Dashboard Name
- Deletion Policy (retain or delete resources when the stack is removed)
- Amazon EFS File System ID
These inputs allow AWS CloudFormation to connect the dashboard with your specific Amazon EFS instance.
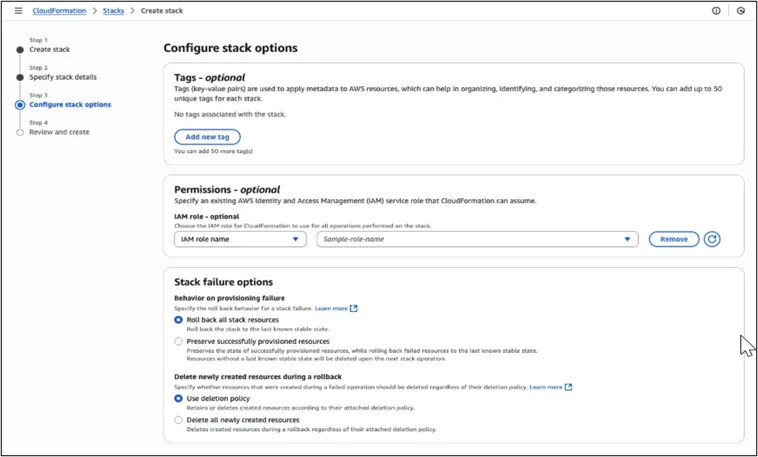
Step 3: Configure Permissions and Options
AWS CloudFormation may automatically create the required AWS IAM resources. If you already have a suitable AWS IAM role with permissions to create Amazon CloudWatch dashboards, you can select it manually. Ensure you acknowledge the AWS IAM resource creation option before continuing.
You may also adjust optional stack settings, such as tags or advanced configuration, based on your organizational standards.
Step 4: Review and Launch the Stack
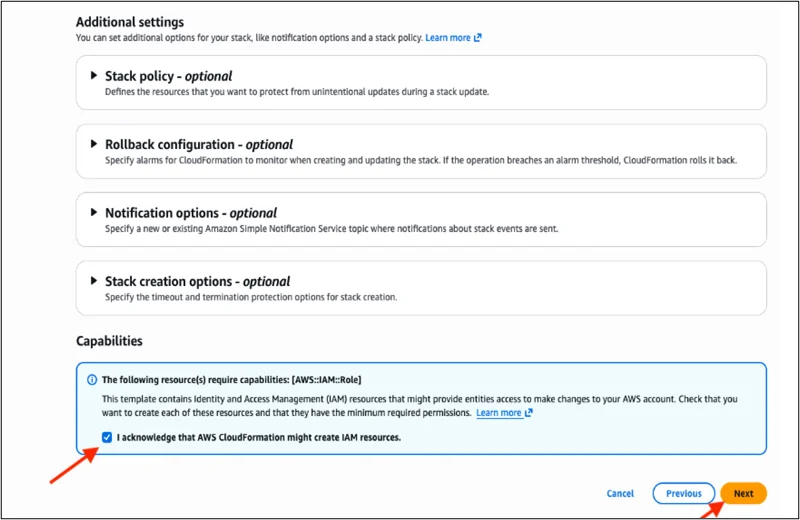
Carefully review the stack configuration to ensure the correct Amazon EFS File System ID and dashboard name are provided. Once verified, submit the stack for creation.
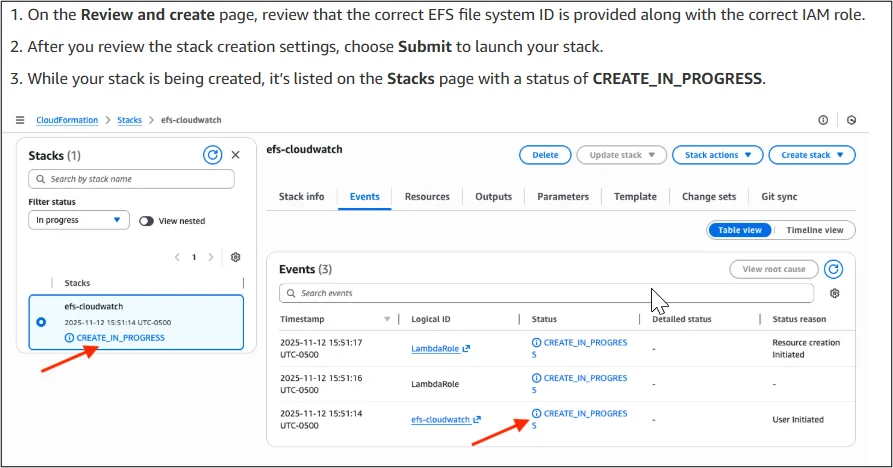
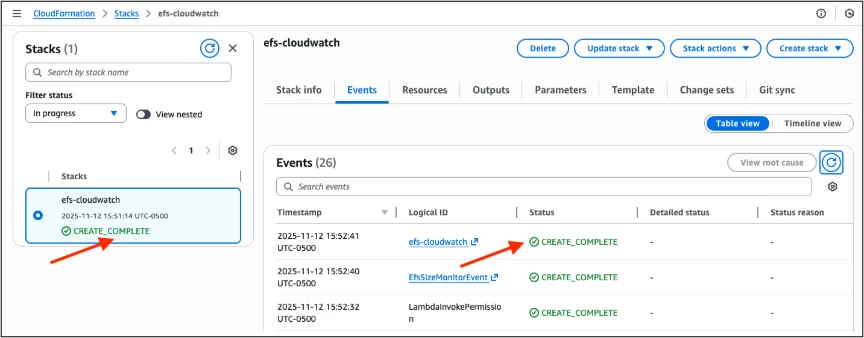
During deployment, the stack status will appear as CREATE_IN_PROGRESS. After successful deployment, the status changes to CREATE_COMPLETE, indicating that the CloudWatch dashboard has been created successfully.
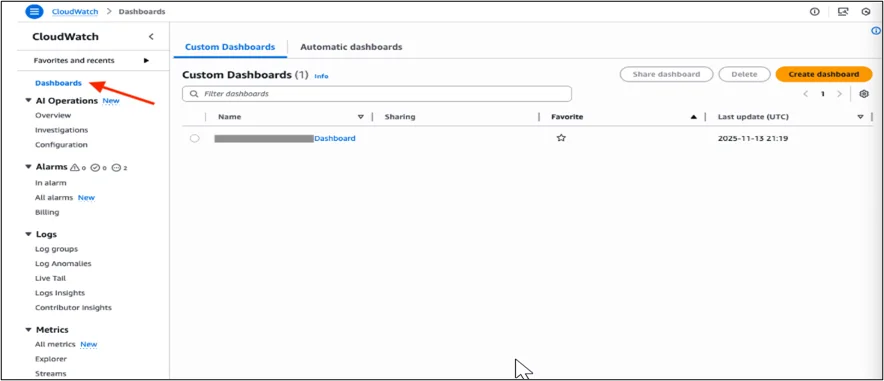
Step 5: View the Amazon CloudWatch Dashboard
Navigate to the Amazon CloudWatch console and open the Dashboards section. Select the newly created dashboard to view real-time metrics of your Amazon EFS file system.
The dashboard will display:
- Total throughput (read, write, and metadata)
- Total IOPS breakdown
- Average I/O size
- Number of client connections
- Storage usage across storage classes
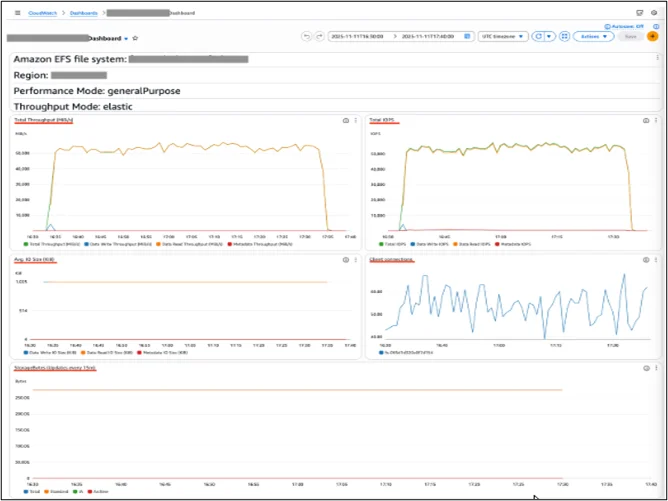
This centralized view provides instant visibility into performance and storage behavior, helping teams quickly identify issues and optimize usage.
Conclusion
Monitoring Amazon EFS with Amazon CloudWatch helps ensure stable storage performance and smooth application operation by tracking key metrics such as throughput, IOPS, I/O size, and storage usage.
Drop a query if you have any questions regarding Amazon EFS and we will get back to you quickly.
Making IT Networks Enterprise-ready – Cloud Management Services
- Accelerated cloud migration
- End-to-end view of the cloud environment
About CloudThat
FAQs
1. What is the purpose of monitoring Amazon EFS KPIs?
ANS: – Monitoring Amazon EFS KPIs helps track storage performance, detect bottlenecks, and ensure applications run smoothly. It allows teams to optimize throughput, IOPS, and storage usage while preventing performance degradation.
2. Which key metrics should be monitored for Amazon EFS?
ANS: – The most important Amazon EFS metrics include:
- Throughput (Read, Write, Metadata)
- IOPS (Read, Write, Metadata)
- Average IO Size
- Client Connections
- Storage Bytes across storage classes
3. Why use AWS CloudFormation for creating the Amazon CloudWatch dashboard?
ANS: – AWS CloudFormation automates the dashboard creation process, eliminating manual configuration. It ensures consistent monitoring across environments, reduces operational effort, and enables quick deployment of standardized dashboards.

WRITTEN BY Shaikh Mohammed Fariyaj Najam
Mohammed Fariyaj Shakh is a Sr. Research Associate – Cloud Engineer at CloudThat with a strong background in AWS and Azure infrastructure management, security, optimization, and automation. Certified in both AWS and Azure, he has hands-on experience in designing, implementing, and managing highly reliable, secure, and scalable cloud solutions. Well-versed in DevOps practices and tools such as Git, GitHub, AWS CI/CD, Jenkins, Docker, Kubernetes, and Terraform, Fariyaj leverages his expertise in automation, Infrastructure as Code (IaC), and container orchestration to build and manage robust deployment pipelines. Known for his strong troubleshooting skills, he delivers effective and scalable solutions to complex cloud challenges.


Comments