

 Login
Login

 September 17, 2025
|
Voiced by Amazon Polly |
Introduction
For years, observability has been built on the foundation of three core telemetry pillars: metrics, logs, and traces. These pillars have served as the cornerstone for understanding and managing the behavior of complex distributed systems:
- Metrics: Show what changed over time with numeric system data.
- Logs: Show what happened with detailed event records.
- Traces: Show where time was spent across services and requests.
While the three observability pillars are vital for monitoring modern applications, they miss a key insight: why resources are used inefficiently, especially at the code level over time.
Continuous profiling, now emerging as the fourth pillar, fills this gap. It offers detailed, code-level visibility into how applications consume resources in production. Unlike metrics, logs, and traces, which focus on system-wide or service-level insights, continuous profiling drills down to function- and even line-level performance.
Pioneers in Cloud Consulting & Migration Services
- Reduced infrastructural costs
- Accelerated application deployment
Continuous Profiling
Continuous profiling continuously collects high-resolution CPU, memory, and other resource usage data from production applications rather than ad hoc. It provides a systematic method of collecting and analyzing performance data from production systems with minimal overhead. (Profiling, in simple terms, measures how your program uses resources like CPU time and memory. Think of it as a way to see inside your application and understand what’s going on.)
Unlike traditional profiling methods that are run manually in test environments or during specific troubleshooting sessions, continuous profiling:
- Runs constantly in production with very low overhead (typically 1-5% CPU overhead)
- Collects lightweight samples across distributed systems automatically
- Provides real-time insights into how code behaves in real-world environments
- Stores profiling data in a time-series database for historical analysis and trend detection
Benefits of Continuous Profiling
- Code-Level Visibility
Complements traditional monitoring (metrics, logs, traces) by providing granular, line-level insights into how application code consumes resources like CPU and memory. - Faster Root Cause Analysis
Reduces Mean Time to Resolution (MTTR) by allowing teams to jump directly to the problematic code when incidents occur, no need to reproduce issues locally. - Proactive Performance Optimization
Identifies inefficient code paths and performance regressions early, before they impact users or trigger alerts, enabling teams to optimize proactively. - Bridging Development and Operations
Gives developers visibility into production behavior and provides SREs with actionable data to optimize system performance, fostering better collaboration. - Cost Efficiency
Helps reduce cloud and infrastructure costs by revealing high resource usage areas (e.g., inefficient algorithms, memory leaks), enabling teams to optimize compute usage. - Improved System Reliability
Enhances incident response and overall stability by providing real-time, actionable insights into application performance during production.
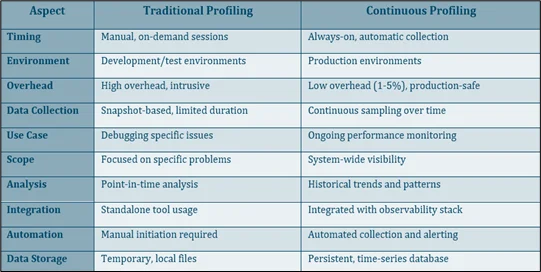
Differences Between Traditional Profiling and Continuous Profiling
Requirements for Continuous Profiling
Supported Languages
Continuous profiling tools support a wide range of programming languages, with different approaches for different language types:
Natively Compiled Languages
- Go: Excellent support with built-in pprof endpoints
- C/C++: Supported via eBPF profiling (requires frame pointers)
- Rust: Supported via eBPF profiling (requires frame pointers)
Runtime-Based Languages
- Java: Comprehensive support via JFR (Java Flight Recorder) and language-specific agents
- Python: Supported via both SDK instrumentation and eBPF (with python_enabled=true)
- Ruby: SDK-based instrumentation available
- js: SDK and auto-instrumentation support
- .NET: Language-specific SDK support
- Scala, Clojure, Kotlin: Supported via JVM-based profiling
Instrumentation Methods
Auto-Instrumentation
Pros:
- No code changes required
- Works with existing applications
- Easy to deploy and manage
- Can profile multiple applications simultaneously
Cons:
- Less granular control
- May not capture application-specific context
- Limited to certain profile types (mainly CPU)
Implementation Options:
- eBPF-based: Kernel-level profiling with minimal overhead
- Agent-based: Language-specific agents that attach to running processes
SDK-Based Instrumentation
Pros:
- Fine-grained control over profiling
- Can add custom tags and context
- Supports multiple profile types (CPU, memory, allocations)
- Better integration with application logic
Cons:
- Requires code modifications
- Need to redeploy applications
- More complex setup and maintenance
Implementation:
- Language-specific SDKs provided by profiling platforms
- Direct integration with application code
- Configurable sampling rates and profile types
Deploying Continuous Profiling
Prerequisites
- Kubernetes cluster (1.32 or +)
- Linux kernel 4.9+ (for eBPF support)
- Helm 3+
- kubectl access
Grafana Installation:
|
1 2 3 4 |
helm repo add grafana https://grafana.github.io/helm-charts helm repo update helm install <release-name> grafana/grafana -n <namespace> |
Pyroscope Installation (main tool):
|
1 2 3 |
helm repo add pyroscope-io https://pyroscope-io.github.io/helm-chart helm install <release-name> pyroscope-io/pyroscope -n <namespace> |
Installing Pyroscope-ebpf:
Pyroscope-ebpf is an auto Instrumentation, running as a Daemonset, Kernel Level profiling (collect CPU profiles and other performance data by leveraging the Linux kernel’s capabilities).
Steps:
- Before installing, download the pyroscope-ebpfyaml (https://github.com/pyroscope-io/helm-chart/blob/main/chart/pyroscope-ebpf/values.yaml)
- Edit the values.yaml at args endpoint as “http://<Pyroscope-release-name>.<namespace>:4040”. The Pyroscope-release-name and namespace should be the same as the Pyroscope main tool above.
|
1 |
helm repo add pyroscope-io https://pyroscope-io.github.io/helm-chart |
If you have already used the above command, you can skip it.
|
1 |
helm install <release-name> pyroscope-io/pyroscope-ebpf |
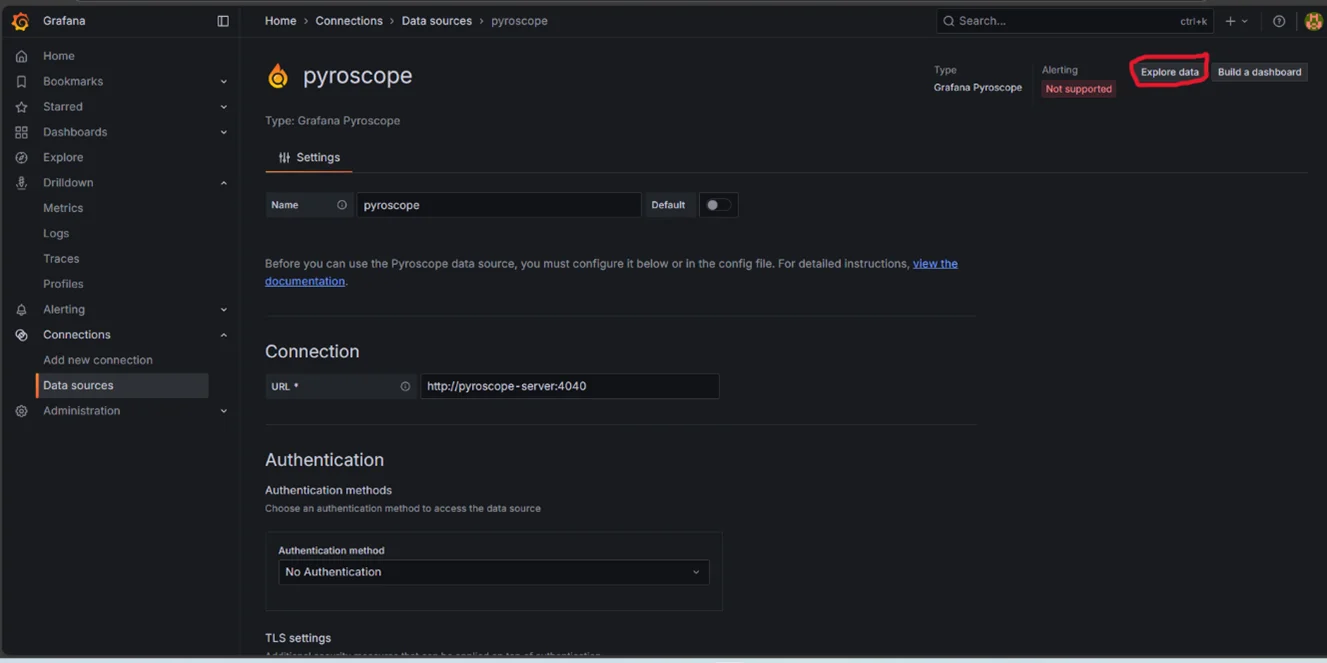
Grafana UI:
- Open Grafana in a web browser, enter admin and password (you can get the secrets of Grafana and decode them with base64).
- Go to Data sources, add New Data source, choose Pyroscope.
- Give Connection URL – “http://<Pyroscope-svc-name>.<namespace>:4040”, click on Save&Test.
- On the top-right side of the data source, you can see “Explore data”, click it.
- By editing the query table (A). If you don’t see anything, adjust the “Absolute Time Range” to last 30minutes at the Top-Right side.
Read and understand Profiles
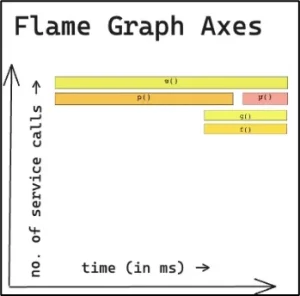
- Each rectangle represents a function in the call stack.
- Width = resource usage (e.g., time or CPU), the wider it is, the more time is spent in that function and its descendants.
- Vertical stacking shows the call hierarchy: top boxes are callers of boxes below; deeper levels represent deeper call stacks.
- The X-axis is not chronological, it’s arranged for clarity, not time sequence.
- Spot hotspots quickly: look for the widest blocks, these are your busiest functions and starting points for optimization
A flame graph helps you see where your application spends time or resources. Each block is a function call:
- Width → how much time/resources it used (wider = heavier).
- Stacking → shows call hierarchy (parent at the bottom, children above).
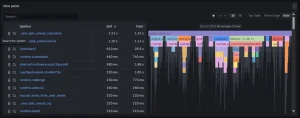
- Self Time → time spent in the function itself, excluding children.
- Total Time → time spent in the function plus everything it called.
- Samples → number of times the profiler saw this function running, translating into time.
To spot bottlenecks:
- Look for the widest blocks → these are your hotspots.
- If Self is high, the function itself is slow.
- If Total is high but Self is low, its children are slow.
Conclusion
Continuous profiling is the next step in observability, the fourth pillar that fills the blind spot left by metrics, logs, and traces by revealing code-level behavior in production.
Drop a query if you have any questions regarding Continuous profiling and we will get back to you quickly.
Empowering organizations to become ‘data driven’ enterprises with our Cloud experts.
- Reduced infrastructure costs
- Timely data-driven decisions
About CloudThat
FAQs
1. Does continuous profiling slow down applications?
ANS: – No, modern profilers (like eBPF-based ones) add very low overhead, typically 1–5% CPU. They use sampling instead of tracing every call, so the performance impact in production is negligible.
2. How can I quickly start with Pyroscope on Kubernetes?
ANS: – Install Pyroscope with Helm, then deploy the pyroscope-ebpf DaemonSet pointing to the Pyroscope service. Finally, it will be connected as a data source in Grafana to explore flame graphs and identify hotspots.

WRITTEN BY Nallagondla Nikhil
Nallagondla Nikhil works as a Research Associate at CloudThat. He is passionate about continuously expanding his skill set and knowledge by actively seeking opportunities to learn new skills. Nikhil regularly explores blogs and articles on various technologies and industry trends to stay up to date with the latest developments in the field.


Comments