

 Login
Login

 September 13, 2023
|
Voiced by Amazon Polly |
Overview
Probability distributions are the core of statistical analysis and data science, which help us comprehend data variability and make wise decisions. From the well-known Normal distribution to the specialized Poisson and multinomial distributions, we explore a variety of distribution types in this blog. Discover how these distributions function, how they are used in actual situations, and how they enable data scientists to draw insightful conclusions from large, complex datasets.
Pioneers in Cloud Consulting & Migration Services
- Reduced infrastructural costs
- Accelerated application deployment
Introduction to Probability Distributions
This thorough book will examine numerous probability distributions, each with distinctive properties, uses, and importance in data science.
The mathematical functions known as probability distributions describe the likelihood of various outcomes in a random experiment. They provide a systematic way to quantify uncertainty and model real-world phenomena. Distributions are crucial for statistical inference, hypothesis testing, and making predictions. By understanding different distribution types, data scientists can choose appropriate models for their analysis and draw accurate conclusions from data.
Normal Distribution
One of the most well-known and extensively studied distributions is the normal distribution, often known as the Gaussian distribution. It is characterized by its symmetric, bell-shaped curve. In a Normal distribution, data is centered around the mean, and the standard deviation determines its spread. This distribution is central to the field of statistics. It plays a vital role in the Central Limit Theorem, which states that the sum of many independent, identically distributed random variables approaches a Normal distribution.
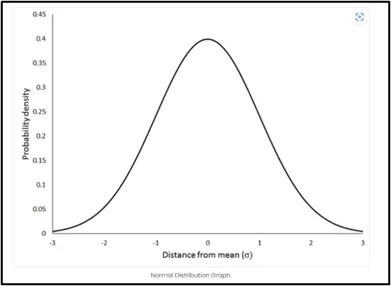
The Normal distribution finds applications in various fields, such as physics, social sciences, and finance. It is a foundation for hypothesis testing, confidence intervals, and regression analysis. We can compare data values and reach inferences about them using Z-scores, which quantify how much a data point deviates from the mean.
Uniform Distribution
The Uniform distribution represents a scenario where all outcomes in a given range are equally likely. A flat and constant probability density function characterizes it. The parameters of a Uniform distribution are the minimum and maximum values of the range. This distribution is commonly used in random number generation, simulations, and random sampling.
In a Uniform distribution, each value within the range has the same likelihood of occurring. This property makes it valuable for scenarios where all outcomes are equally likely, such as rolling a fair die or selecting a card from a well-shuffled deck.
Exponential Distribution
The exponential distribution describes the interval between events in a Poisson process. It is frequently used to simulate the period spent waiting for an event to occur. The Exponential distribution is characterized by its memoryless property, which means that the probability of an event occurring in each time interval is independent of how much time has passed.
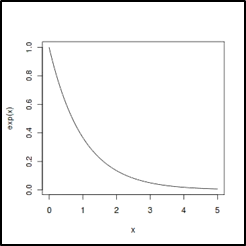
This distribution has applications in various fields, including reliability engineering and survival analysis. It helps analyze the time between failures of mechanical components, customer arrivals at service points, and more. The rate parameter (λ), which establishes the typical rate of event occurrence, serves as the sole defining characteristic of the exponential distribution.
Poisson Distribution
The number of events that occur over a predetermined time or space is modeled using the Poisson distribution. It works well in situations where unusual and unrelated events occur. The Poisson distribution is characterized by its probability mass function, which calculates the probability of observing a specific number of events in a given interval.
Applications of the Poisson distribution range from analyzing phone call arrivals at call centers to studying the number of defects in a manufacturing process. A single parameter defines the distribution, the average rate (λ) of events in the interval.
Binomial and Multinomial Distributions
The binomial distribution modeled the number of successes in a set number of independent Bernoulli trials with two possible results (success or failure). It is characterized by its probability mass function, which calculates the probability of observing a specific number of trial successes.
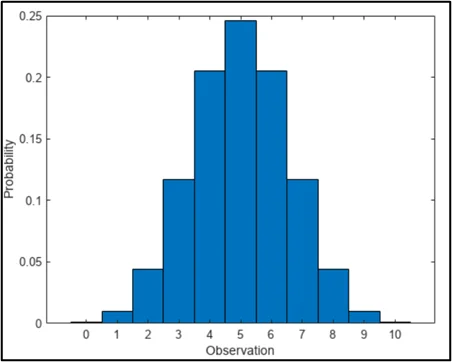
The multinomial distribution is a generalization of the binomial distribution to situations with many categories. It models the distribution of outcomes in a categorical experiment. Parameters include the number of trials (n) and the probabilities for each category.
These distributions find applications in various fields, such as quality control, genetics, and marketing. They are used to analyze the probability of success in a series of independent events and to make predictions based on observed data.
Conclusion
Probability distributions are the cornerstone of data science, enabling us to unravel the mysteries of data variability and uncertainty. From the ubiquitous Normal distribution to specialized distributions like the Chi-Square and Poisson, each type serves a unique purpose in data analysis. As data scientists, understanding these distributions empowers us to make informed decisions, develop robust models, and extract meaningful insights from complex datasets. By mastering these distribution types, we unlock the ability to unveil new dimensions of knowledge and innovation in data science. So, whether you’re exploring the bell-shaped curve of the Normal distribution or counting rare events with the Poisson distribution, remember that these distributions are your allies in the quest for understanding the data-driven world around us.
Click here for Part 2.
Drop a query if you have any questions regarding Probability Distributions and we will get back to you quickly.
Making IT Networks Enterprise-ready – Cloud Management Services
- Accelerated cloud migration
- End-to-end view of the cloud environment
About CloudThat
FAQs
1. What is the significance of probability distributions in data science and statistics?
ANS: – Probability distributions are fundamental tools in data science and statistics because they provide a structured way to understand and quantify uncertainty in various scenarios. They enable us to model and analyze real-world phenomena, make informed decisions based on data, perform hypothesis testing, and estimate probabilities for different outcomes.
2. How does the Normal distribution relate to the Central Limit Theorem?
ANS: – The Central Limit Theorem (CLT) and the Normal distribution are closely related. The CLT states that regardless of the initial distribution of the variables, the total or average of a large number of independent, identically distributed random variables tends to follow a Normal distribution. This property is crucial in statistics, as it allows us to apply Normal distribution properties to various data, making methods like hypothesis testing widely applicable.
3. How does the Poisson distribution differ from the Binomial distribution, and when should each be used?
ANS: – The Poisson distribution is appropriate for modeling the number of uncommon, independent events in a specified interval. It speaks about things like receiving a phone call, manufacturing flaws, or the advent of a rare disease. On the other hand, the binomial distribution models the number of successes in a fixed number of independent trials, with each trial having two possible outcomes. It’s used when events have a binary outcome, such as coin flips or success/failure experiments.

WRITTEN BY Vinay Lanjewar
Vinay specializes in designing and implementing scalable data pipelines and end-to-end data solutions on the AWS Cloud. Skilled in technologies such as Amazon EC2, S3, Athena, Glue, QuickSight, and Lambda, he also leverages Python and SQL scripting to build efficient ETL processes. Vinay has extensive experience in creating automated workflows using AWS services, transforming and organizing data, and developing insightful visualizations with Amazon QuickSight. His work ensures that data is collected efficiently, structured effectively, and made analytics-ready to drive informed decision-making.


Comments