

 Login
Login

 March 17, 2022
|
Voiced by Amazon Polly |
The Cambridge Analytica- Facebook scandal of 2018 exposed the misuse of information of over 81 million users. It is simply beyond understanding how these datasets were collected, stored, analyzed, and utilized to identify patterns that were predominantly used for political advertising!
When you think of data, usually an excel comes into the picture, which has alphanumerics in the rows and columns t. However, in recent days, the number of data companies are handling cannot fit into an excel file or any other daily usage BI tools. There must be an alternate!
The answer of Data Science.
Start Learning In-Demand Tech Skills with Expert-Led Training
- Industry-Authorized Curriculum
- Expert-led Training
1. Introduction to Exploratory Data Analysis
EDA (Exploratory Data Analysis) is the stepping stone of Data Science, and the process involves investigating data and discovering underlying patterns in data. The EDA process is a step-by-step approach from identifying the types of variables to summarizing data in the form of visual graphs.
Let us deep dive and get into the technical nitty-gritty.
2. Why Databricks?
Generally, data bricks are preferable when the data scale is too large. Dealing with small datasets can be managed by Pandas library; while dealing with larger data sets, there is a need for parallel processing to compute scientific calculations much faster. Apache Spark Community provides pyspark.sql.functions to collaborate the use of Spark and Python. It helps us work with RDD (Resilient Distributed Dataset) and DataFrames at a much faster pace.
Here is the step-by-step approach of EDA:
- Importing data in data bricks
- Descriptive Statistics
- Missing value imputation
- Graphical representation
Let us look at each one of these individually.
3. Importing data in data bricks
- Small .csv or data files can be imported to DBFS using the UI.


Reading data on cluster Nodes with SPARK is preferable for large datasets1sparkDF = spark.read.csv("csvPath", header="true", inferSchema="true")
4. Descriptive Statistics
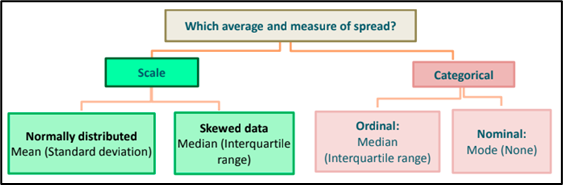
- Summary statistics or descriptive statistics summarize and formulate characteristics of a data set from a sample or the population dataset. The first idea is to categorize the type of data a column contains. Refer to the below chart for more ideas on the type of variables and values contained.
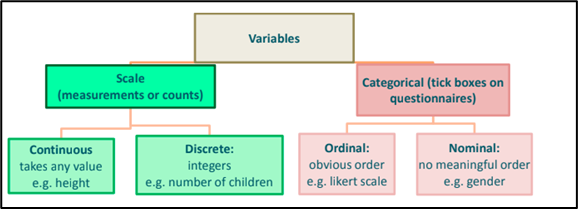
- The first step is to do quantitative research of how the data is, for example, this may include operations such as deriving the average of one variable or relations between two variables.
 12dataframe.describe()#Gives the descriptive statistics of each column pyspark code12df.describe().show()#df refers to the dataframe,
The query includes count, mean, standard deviation, min, Max
5. Missing value imputation
- Dropping or Imputing Rows with missing values
-> Handling missing values in a data frame mostly depends upon the type of data present. If in a particular row most of the columns are missing the ideal way to handle missing values is to drop the row. If considerably a smaller number of columns are missing in a particular row we can replace them with mean median and mode depending upon the type of the variables.
-> Visit this official documentation of Spark for more information on the query. - Imputation method for categorical columns:
-> Replacing missing values in a categorical column works differently from that of a numeric value. While creating categorical columns the missing values can be imputed with the most frequent category that is missing. If the total amount of missing values is large enough, it can be replaced with a new category such as “not specified”.
-> The pros of doing this is there is less data loss and it negates the loss of data by adding a new value - Using Algorithms that support missing values:
-> There are other advanced imputation methods such as KNNImputer, and Last observation carried forward (LOCF).
Visit this documentation for an implementation guide.
-> Other classification and regression algorithms can also be used to predict the missing values in a data set such as Naïve Bayes and Random Forest. They work best on categorical and non-linear data.
Here are some links that can help you:
1.9. Naive Bayes — scikit-learn 1.0.2 documentationsklearn.ensemble.RandomForestClassifier — scikit-learn 1.0.2 documentation
6. Graphical Representation
- Databricks supports various visualizations out of the box using the display and displays HTML functions. A display function along with the data frame would give a generalized profiling visualization of the entire dataset.
12#profiles the dataframe to the dashboarddisplay(dataframe)

The display function supports a rich set of graphs for visualization.

Refer to the below table for implementing graphs and visualizing data based on the data type of the columns:

7. Conclusion
When there is a need to process and transform massive quantities of data and explore the underlying patterns in data through machine learning models, Databricks is a go-to tool. It works well with both large and small datasets. In addition, it uses parallel processing to give faster execution on larger datasets, making the EDA process more simplified.
It has more effortless connectivity with Amazon S3; with just one line of code, you can import datasets and store the resultant datasets back to S3.
Upskill Your Teams with Enterprise-Ready Tech Training Programs
- Team-wide Customizable Programs
- Measurable Business Outcomes
About CloudThat

WRITTEN BY Bineet Singh Kushwah
Bineet Singh Kushwah works as an Associate Architect at CloudThat. His work revolves around data engineering, analytics, and machine learning projects. He is passionate about providing analytical solutions for business problems and deriving insights to enhance productivity. In his quest to learn and work with recent technologies, he spends most of his time exploring upcoming data science trends and cloud platform services, staying up to date with the latest advancements.


Comments