

 Login
Login

 February 17, 2023
|
Voiced by Amazon Polly |
Introduction
Amazon QuickSight is a business analytics service handed by Amazon Web Services (AWS) that allows you to produce visualizations, perform ad-hoc analysis, and make dashboards to gain insights from your data. In addition to these capabilities, Amazon QuickSight also provides the capability to produce Paginated Reports.
Start Learning In-Demand Tech Skills with Expert-Led Training
- Industry-Authorized Curriculum
- Expert-led Training
What are Paginated Reports?
There are various sorts of reporting formats that can be used to store and share information. “Paginated Reports” is one of the formats. Paginated reports are print-ready documents created with the best printing and delivery in mind. They are polished reports that can be used for yearly reports, product catalogs, and marketing materials, among other things. The fundamental benefit of paginated reports is their polished, expert appearance. They can be utilized to create a positive first impression on potential customers or investors.
All information present when the report is published as a PDF or CSV is provided in paginated reports. Let’s imagine, for illustration, that your table contains 10,000 rows. A paginated report distributes the entire document over several pages so readers can view it. The resulting PDF includes a screenshot of the table that fills a single scrollable page when you use the same table in an interactive dashboard report. These tailored reports can be distributed to specific users or groups using email bursts to produce up to a million personalized PDF or CSV reports.
Customers may produce and distribute highly structured, customized reports containing business-critical data to hundreds of thousands of end users with Amazon QuickSight Paginated Reports without needing infrastructure setup or maintenance, upfront licensing, or long-term commitments.
How to create Amazon QuickSight Paginated reports?
Use the built-in report editor in Amazon QuickSight to design and format your report using a drag-and-drop interface to create paginated reports. You can add data tables, charts, images, and other visualizations to your report and format them using various design tools such as color palettes, fonts, and styles.
When your report is finished being designed, you can share it with the people as appropriate after previewing it and publishing it to the Amazon QuickSight server. Users can read and download the reports in PDF format from any device.
Customers can also programmatically interact with Amazon QuickSight Paginated Reports using the AWS API and SDK.
Steps for Creating QuickSight Paginated Reports
Step 1 – Open the QuickSight console and select the dataset you will use for reporting purposes.
Step 2 – Check and confirm the dataset and select the Use in Analysis option.
Step 3 – Select the sheet type as Paginated report from the interactive sheet or Paginated report options. Here, you can change settings for things like paper size and orientation.

Step 4 – Now, you can start creating an Analysis.
Steps to Publish and Schedule Reports
Step 1 – After completing the analysis, select Share and then Publish Dashboard option.

Step 2 – To set a schedule to deliver the reports to readers, define a schedule by selecting Add schedule from the Dashboard.
Step 3 – You can specify the schedule name and format of the report as PDF or CSV, schedule frequency as Daily, Weekly, Monthly, or one-time delivery, etc.
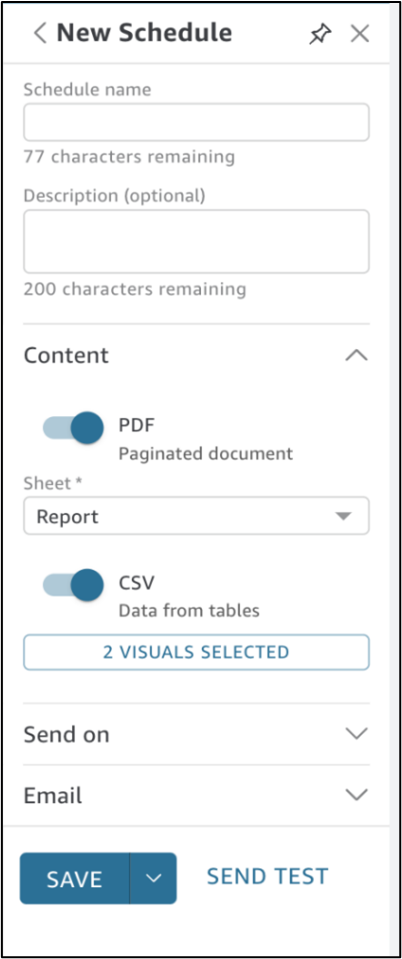
Step 4 – You can send the report as a download link or file attachment by specifying the readers’ e-mail. Additionally, a copy of the sent-out report’s snapshot is saved by Amazon QuickSight. You can access them at any time.
Availability and Pricing
Amazon QuickSight Paginated Reports can be added to the current Amazon QuickSight Enterprise or Enterprise equipped with Q in all supported AWS Regions.
Conclusion
Readers can easily consume information in a familiarized and scheduled manner with the help of Amazon QuickSight Paginated Reports’ finely structured models in PDF or CSV formats. This feature makes it simple for authors of reports to create documents with specific page dimensions, pictures, texts, charts, and tables.
This service also benefits IT executives with fully managed reporting capabilities incorporated into Amazon QuickSight. As a result, setting up and maintaining reporting systems requires less time and money. This motivates IT executives to think about transferring conventional reporting to the cloud to save time and money.
Upskill Your Teams with Enterprise-Ready Tech Training Programs
- Team-wide Customizable Programs
- Measurable Business Outcomes
About CloudThat
FAQs
1. What is Amazon QuickSight?
ANS: – Amazon QuickSight is a serverless cloud-based business intelligence platform that enables customers to build dashboards and visualizations and share them with businesses.
2. What is the difference between QuickSight Author and Reader?
ANS: – Users that use QuickSight Author can connect to data sources, create dashboards, and perform data analysis. QuickSight Reader can see the shared reports, filter the data, and export them in available formats such as PDF, Word, Excel, or CSV.
3. Is Amazon QuickSight available for mobile devices?
ANS: – Yes. QuickSight mobile app is available on Android and iOS. Amazon QuickSight can also be accessed through any mobile device’s web browser.

WRITTEN BY Aehteshaam Shaikh
Aehteshaam works as a SME at CloudThat, specializing in AWS, Python, SQL, and data analytics. He has built end-to-end data pipelines, interactive dashboards, and optimized cloud-based analytics solutions. Passionate about analytics, ML, generative AI, and cloud computing, he loves turning complex data into actionable insights and is always eager to learn new technologies.


Comments