

 Login
Login

 June 26, 2026
|
Voiced by Amazon Polly |
Organizations may assess and improve the operational health of resources such as apps, flows, and agents by using the Monitor section of the Power Platform admin center. It provides administrators and makers with insights to enhance resource performance and understand aggregate health metrics.
Start Learning In-Demand Tech Skills with Expert-Led Training
- Industry-Authorized Curriculum
- Expert-led Training
Value Proposition
Using the Monitor area enables users to identify resources needing attention, thereby enhancing operational efficiency and resource management within the Power Platform.
- Monitoring Features: Access metrics, logs, and resource recommendations.
- Prerequisites: Tenant-level analytics must be enabled, and users need appropriate roles to view resource data.
- Architecture: Metrics derive from runtime activity; unused resources do not appear in monitoring.
- Resource Health Overview: Users can view health metrics, recommendations, and logs for selected resources.
- Limitations: Metrics are time-aggregated, and logs are available for only seven days; metrics are available for up to 28 days.
The Power Platform admin center’s Monitor section allows the company to track and enhance operational health metrics for newly developed or deployed resources. Apps, flows, and agents are some of these resources.
The Monitor experience is available to both makers (in experiences such as Power Apps) and admins (in experiences such as the Power Platform admin center). The data is used by makers to enhance their resources. Administrators use it to assess the overall operational health of the tenant or specific settings. Metrics are not real-time; instead, they are computed by combining daily event records from runtime activities. The following sources are used to determine recommendations:
- Aggregation of runtime event logs to highlight a measurable opportunity for improving a health metric
- Static analysis of resource properties that can be changed to improve a health metric.
On the Logs page, one can examine and download the event logs that are used to compute metrics. Operational health analysis can benefit from their assistance.
Prerequisites
- Tenant-level analytics must be turned on to make data available for Monitor experiences.
- You must be assigned the system administrator role for the environment to view the names of resources that belong to it.
- A managed environment is required to view Monitor recommendations.
Architecture
To create recommendations and health metrics, a Power Platform Runtime activity is required to monitor experiences. In Monitor experiences, unused resources don’t show up. Power Platform service and Dynamics 365 administrators can view Monitor data throughout the tenant (Fig 1).
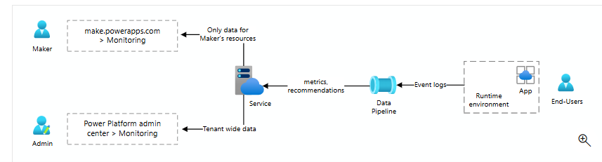
Fig 1. Architecture
Only resources for which they have edit privileges in the runtime environment can be viewed by makers. The maker portals for Power Automate and Copilot Studio lack a monitoring page. For comparable experiences, customers can utilize the Copilot Studio Analytics tab and the Power Automate Automation Center.
Purpose of the Monitor Area of the Power Platform Admin Center
The Power Platform admin center’s Monitor section highlights resources with potential for improvement and draws attention to those whose operational health has declined.
The cards on the Overview page indicate the status of your triggered custom and predefined alerts, highlighting which resources are experiencing suboptimal operational health and need your attention most.
In the products view, you can compare health metrics across a pool of common resources, such as apps. You can select a resource to view its health metrics, recommendations, and logs.
View a resource’s health metrics, recommendations, and logs.
- Select a product, such as Power Apps.
- Select a specific resource.
- Review the details pane, which includes time-series charts for each available metric.
- If a recommendation is available, select the contextual button in it. You can also share the recommendation with a user.
Ensure Continuous Resource Health
To ensure services function properly and users are not affected, it is crucial to monitor resource status in the Microsoft 365 Admin Center. Administrators may promptly identify problems, take preventive action, and preserve system reliability by routinely monitoring Service Health, staying informed through the Message Center, reviewing reports, and setting up alerts. Proactive updates, timely alerts, and regular monitoring result in improved system performance and reduced downtime.
Upskill Your Teams with Enterprise-Ready Tech Training Programs
- Team-wide Customizable Programs
- Measurable Business Outcomes
About CloudThat

WRITTEN BY Sushma Uday Kamat
Sushma is a recognized Microsoft Certified Trainer (MCT) and Subject Matter Expert with a strong track record in Power Platform trainings. With a background in Electronics and Communication Engineering, she has delivered high-impact training to over 1000 professionals across Fortune 500 companies. Her expertise spans Microsoft Power Platform, and she brings real-world experience as a Developer for various projects related to her domain. She was honored with the Top 100 MCT Quality Award 2025 globally in All Courses, reflecting her excellence in technical enablement.


Comments