

 Login
Login

 August 25, 2025
|
Voiced by Amazon Polly |
Introduction
Modern data pipelines on AWS can span multiple services, such as AWS Glue jobs, AWS Lambda functions, Amazon EMR clusters, Amazon S3 buckets, and more. Ensuring reliability and performance at scale means proactively catching issues before they impact business. This is only possible with monitoring and alerting strategies. AWS provides a rich ecosystem of services, including Amazon CloudWatch, AWS CloudTrail, and Amazon Simple Notification Service (Amazon SNS), offering a scalable, integrated framework for observing, tracking, and responding to events in your data workflows.
Pioneers in Cloud Consulting & Migration Services
- Reduced infrastructural costs
- Accelerated application deployment
The Building Blocks
Amazon CloudWatch
- Logs: Ingests logs from AWS services (AWS Lambda, AWS Glue, Amazon EMR, Amazon ECS, etc.)
- Metrics: Offers real-time and custom metrics like invocation count, failure rates, duration, and resource usage.
- Alarms: Set thresholds on any metric to trigger alerts or automation.
- Dashboards: Visualize resource utilization and pipeline health.
AWS CloudTrail
- API Audit Logs: Tracks API calls and user actions, who did what, and when.
- Security: Detects unauthorized access, tracks admin actions, and provides crucial evidence in incident response.
- Integration: Can trigger Amazon CloudWatch Events/Rules for automated responses.
AWS SNS (Simple Notification Service)
- Alerts and Notifications: Delivers alerts such as email, SMS, Slack messages, and webhooks, and even triggers AWS Lambda functions.
- Decoupled: Scalable publish/subscribe model, integrates seamlessly with Amazon CloudWatch alarms.
Example: Monitoring a Data Pipeline
Consider you have an event-driven pipeline with the following components:
- Amazon S3 bucket ingests raw data files.
- AWS Lambda triggers AWS Glue ETL job.
- AWS Glue job processes and stores data in Amazon S3 or Amazon Redshift.
- Amazon Athena queries support dashboards.
Each stage presents points of potential failure or performance drift. Here’s how you would instrument this architecture:
- Logging and Metric Collection
- Configure all AWS Glue jobs and AWS Lambda functions to stream logs to Amazon CloudWatch.
- Enable step/job-level metrics (success, failure, duration, throughput).
- Instrument custom metrics, e.g., records processed, error rates.
- Alarms and Notifications
- Amazon CloudWatch Alarm for high AWS Glue job error rates:
- Set threshold (e.g., more than 2 failed runs in 1 hour).
- Attach the Amazon SNS topic for immediate engineer notification.
- AWS Lambda timeout alert: Monitor function durations and trigger an alarm if they exceed timeouts, indicating possible input, code, or downstream issues.
- Amazon S3 ingestion delays: Trigger alarms for expected object arrivals; send alerts if files are missing or late.
- Auditing and Security with AWS CloudTrail
- Track all pipeline changes: Who modified the AWS Glue scripts? Who triggered new runs or altered AWS IAM permissions?
- Detect anomalies: Spot unauthorized access, privilege escalation, or attempts to delete Amazon S3 data.
- Incident response: Use AWS CloudTrail logs to reconstruct events after a security incident.
Setting Up Example: Monitoring AWS Lambda with Amazon CloudWatch & Amazon SNS
Create an Amazon CloudWatch Alarm to notify on errors:
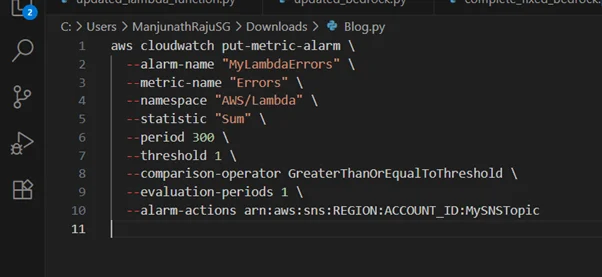
- This setup ensures that whenever AWS Lambda execution errors are detected, immediate alerts are sent to the responsible team.
Dashboarding: Visualizing Your Pipeline
- Use Amazon CloudWatch Dashboards to create unified views: AWS Glue job progress, Lambda success/failures, Amazon S3 storage trends, and Amazon Athena query counts.
- Set up cross-account or cross-region dashboards for enterprise-level observability.
Automation and Automated Response
- Subscribe AWS Lambda functions or AWS Step Functions to Amazon SNS topics for automated remediation (e.g., deleting failed partitions, auto-retrying jobs).
- Use Amazon CloudWatch Events to trigger workflows (run diagnostic jobs, scale resources) based on alarm states.
Best Practices
- Centralized Logging: To simplify audit and compliance, use a centralized log account or bucket for all Amazon CloudWatch logs.
- Structured Logs: Emit logs in JSON format for easy searching and parsing.
- Retention Policies: Set log retention in Amazon CloudWatch to balance compliance and cost.
- Health Checks: Use AWS Health and Amazon EventBridge for platform-wide incident awareness.
- Regular Reviews: Periodically review alarm thresholds and notification policies as workloads evolve.
Common Pitfalls
- Over-alarming: Group similar alarms, use composite alarms, and tune thresholds.
- Neglecting metrics granularity: Default metrics may not be enough, instrument custom, domain-specific metrics.
- Ignoring cost: Very high log volumes can get expensive, aggregate or sample logs as necessary.
Conclusion
Enhanced monitoring and alerting are the backbone of reliable, scalable data engineering on AWS.
As your data pipelines scale, these best practices ensure resilience, security, and business continuity, keeping minor glitches from becoming major outages.
Drop a query if you have any questions regarding Data engineering on AWS and we will get back to you quickly.
Empowering organizations to become ‘data driven’ enterprises with our Cloud experts.
- Reduced infrastructure costs
- Timely data-driven decisions
About CloudThat
FAQs
1. How do Amazon CloudWatch, AWS CloudTrail, and Amazon SNS work together to monitor AWS data pipelines?
ANS: – Amazon CloudWatch collects logs and metrics, and AWS CloudTrail provides an audit trail for API actions. Amazon SNS delivers real-time alerts, forming a full-stack observability solution that enables detection, notification, and response for data workflow issues.
2. What’s the best practice for setting up automated alerts for job failures in a data pipeline?
ANS: – Configure Amazon CloudWatch Alarms on relevant metrics (such as error counts or durations), link them to Amazon SNS topics for instant notifications, and automate escalation to response teams or systems as needed.
3. How can AWS CloudTrail improve the security of my AWS data pipeline?
ANS: – AWS CloudTrail tracks all API activity and resource changes, helping you detect unauthorized actions, investigate incidents, and comply with auditing policies by providing detailed user and service behavior records.

WRITTEN BY Manjunath Raju S G
Manjunath Raju S G works as a Research Associate at CloudThat. He is passionate about exploring advanced technologies and emerging cloud services, with a strong focus on data analytics, machine learning, and cloud computing. In his free time, Manjunath enjoys learning new languages to expand his skill set and stays updated with the latest tech trends and innovations.


Comments