

 Login
Login

 July 28, 2026
|
Voiced by Amazon Polly |
Introduction
Every AWS environment eventually reaches a point where telemetry outpaces the humans watching it. Amazon CloudWatch alarms multiply, dashboards sprawl, and root-cause analysis becomes tribal knowledge rather than a repeatable process. A Gen AI Monitoring and Alerting Agent closes that gap. It sits on top of Amazon CloudWatch, X-Ray, and Config, reading the same telemetry an on-call engineer would, but correlating it, explaining it in plain English, and surfacing a recommendation before a person finishes opening the dashboard. This guide covers the problem, the AWS architecture, and the guardrails that keep it safe as a read-only first step into Gen AI-driven operations.
Pioneers in Cloud Consulting & Migration Services
- Reduced infrastructural costs
- Accelerated application deployment
What Is a Gen AI Monitoring & Alerting Agent?
A traditional monitoring agent is a set of thresholds, CPU above 90 percent, and latency above 500ms, that fires an alarm and leaves interpretation to a human. A Gen AI agent keeps those thresholds but adds a reasoning layer: it ingests the same metrics, logs, traces, and config changes, then uses a foundation model to interpret them together. A threshold tells you a number crossed a line; the agent tells you why, what else is affected, and what to do next. Because it only reads telemetry and never modifies infrastructure, it is the lowest-risk entry point for introducing generative AI into operations.
Core Capabilities with AWS Scenarios
Data Ingestion Layer
The agent needs a single normalized stream rather than seven disconnected consoles: Amazon CloudWatch Metrics and Logs, X-Ray traces, AWS Config change events, AWS Health notifications, VPC Flow Logs, and Container Insights. Amazon Kinesis Data Streams buffers this telemetry with sub-second latency, AWS Lambda normalizes the heterogeneous payloads into one schema, Amazon OpenSearch Serverless indexes it for fast search, and Amazon S3 holds the long-term archive cost-effectively.
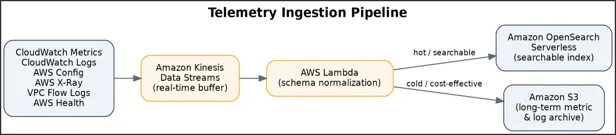
Figure 1. Telemetry is normalized and split across a hot OpenSearch index and a cold S3 archive.
Multi-Layered Anomaly Detection
A single detection method produces too much noise or too little insight, so the agent layers three approaches: statistical checks (Amazon CloudWatch Anomaly Detection, Z-score/IQR) catch obvious violations; Amazon SageMaker time-series models (DeepAR, Prophet) catch seasonal deviations a fixed threshold would miss; and Amazon Bedrock reasons across correlated metrics and past incidents to explain the anomaly in plain English. A server at 85% CPU may sit under a static 90% threshold. Yet, the ML layer flags it as unusual for that hour, and Bedrock connects it to a simultaneous error spike and a deployment two hours earlier, a root-cause hypothesis in one step, rather than 20 minutes of manual log-grepping.
Event Correlation & Predictive Analytics
Incidents cascade across services, so the correlation engine groups events by a rolling time window and by resource dependency graph, then asks Amazon Bedrock to identify the causal chain, turning three separate pages into a single alert that names the actual root cause. The same normalized history also runs forward: linear regression flags disk exhaustion 24–72 hours out, gradient analysis catches memory leaks 2–6 hours ahead, and seasonal decomposition anticipates traffic spikes, all against the pipeline already in place.
Knowledge Base (RAG Layer)
Metrics alone describe a symptom but recommend nothing useful, so Amazon Bedrock Knowledge Bases treats an Amazon S3 bucket of runbooks, RCA reports, and playbooks as a retrievable corpus. Titan embeddings convert it into vectors in Amazon OpenSearch Serverless, and every query is matched against that store before the LLM responds, grounding recommendations in what the team has actually documented.
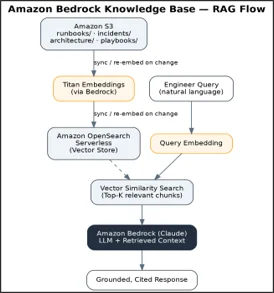
Figure 2. Runbooks are embedded once and retrieved per query, grounding every response.
Response Generator & Conversational Interface
One analysis pass produces a Slack/Teams alert summary, a detailed dashboard write-up, a ticketing system runbook link, an executive email digest, and a conversational reply, each formatted for its audience and including specific metric deltas and prioritized actions. Engineers can also ask directly: “How’s production doing?” or “Why did latency spike at 3 PM?” The agent reconstructs the timeline and identifies the known defect responsible, as it was already indexed in a past incident.
AWS Architecture for the Monitoring Pipeline
Telemetry feeds a normalization pipeline, the AI engine reasons over it with the knowledge base grounding recommendations, and the response generator routes findings to the right channel. Amazon EventBridge threads the stages together using Amazon CloudWatch and AWS Config events, while AWS Step Functions orchestrates longer workflows, and a single Amazon Bedrock call synthesizes a report.
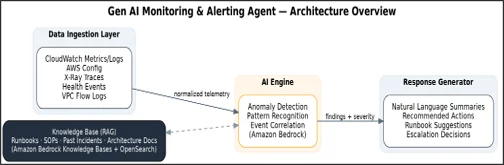
Figure 3. Ingestion, AI reasoning, and response generation share a common knowledge base.
Amazon Bedrock (Claude) is the reasoning core, Amazon SageMaker handles cheaper forecasting, so LLM calls are reserved for real ambiguity, Amazon OpenSearch Serverless serves as both vector store and log index, Amazon S3 anchors telemetry and knowledge-base source documents, and Amazon API Gateway exposes the conversational interface to Slack and Teams.
End-to-End Pipeline Steps
- Amazon CloudWatch alarm changes state, or an Amazon EventBridge rule fires, triggering the pipeline.
- AWS Lambda gathers related metrics, recent AWS Config changes, and similar past incidents from the Knowledge Base.
- Amazon Bedrock returns a root-cause hypothesis, impact assessment, severity, and confidence score.
- The response generator routes the analysis to Slack/Teams, PagerDuty, or the dashboard.
- Every recommendation logs to AWS CloudTrail and Amazon S3, and low-confidence or critical findings escalate to a human.
Guardrails, KPIs, and Cost
Permissions are deliberately narrow, AWS IAM grants only Describe, Get, and List, so the agent observes but never changes infrastructure. Every recommendation carries a confidence score, and low-confidence or critical findings page a human immediately. All decisions log to AWS CloudTrail, and rate limiting caps LLM invocations per minute.
Typical targets: MTTD under 2 minutes (from ~15), MTTR under 15 minutes (from ~45), ~70% fewer false-positive alerts, and 85%+ root-cause accuracy once the knowledge base matures. The combined AWS services, Amazon Bedrock, Knowledge Bases, OpenSearch Serverless, AWS Lambda, Amazon Kinesis, Amazon S3, Amazon EventBridge, Amazon SageMaker, typically run a few thousand dollars a month, and recover several times over in a single prevented outage.
Conclusion
Part 2 covers what comes next.
Drop a query if you have any questions regarding Amazon CloudWatch, and we will get back to you quickly.
Empowering organizations to become ‘data driven’ enterprises with our Cloud experts.
- Reduced infrastructure costs
- Timely data-driven decisions
About CloudThat
FAQs
1. Does this agent replace Amazon CloudWatch alarms?
ANS: – No, it sits on top of them, adding correlation and explanation, and can run in shadow mode before taking over alert routing.
2. Why start read-only instead of auto-remediating?
ANS: – A read-only agent carries no risk of a wrong automated action, making it the safest place to build trust before extending scope.
3. What happens if a recommendation is wrong?
ANS: – The agent only recommends. Low-confidence or critical findings route to a human, with the full reasoning trail in the audit log.


WRITTEN BY Bineet Singh Kushwah
Bineet Singh Kushwah works as an Associate Architect at CloudThat. His work revolves around data engineering, analytics, and machine learning projects. He is passionate about providing analytical solutions for business problems and deriving insights to enhance productivity. In his quest to learn and work with recent technologies, he spends most of his time exploring upcoming data science trends and cloud platform services, staying up to date with the latest advancements.


 PREV
PREV






Comments