

 Login
Login

 September 1, 2025
|
Voiced by Amazon Polly |
Introduction
Logging is crucial to database management in the digital transformation era, enabling effective monitoring, troubleshooting, and security. Amazon RDS and Amazon Redshift are widely used managed database services in the AWS ecosystem.
In this blog, we will provide an in-depth guide to enabling various logs, such as error logs, general logs, slow query logs, and audit logs, for both Amazon RDS and Amazon Redshift.
Pioneers in Cloud Consulting & Migration Services
- Reduced infrastructural costs
- Accelerated application deployment
Enabling Logging for Amazon RDS
Amazon RDS supports a variety of database engines, including MySQL, PostgreSQL, SQL Server, and Oracle, and each engine has different logging capabilities. However, the basic principles of enabling logs and the types of logs available remain the same. Below are the main types of logs you should enable in Amazon RDS:
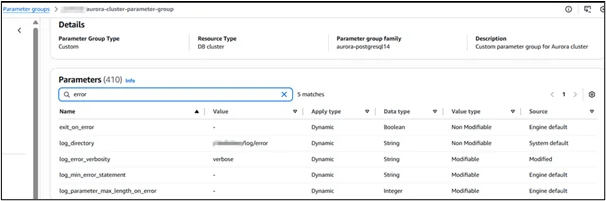
a. Error Logs
Error logs capture critical information about issues with the database, including failures, connection problems, and other severe events.
Key parameters for error logs in PostgreSQL or MySQL:
log_error_verbosity (PostgreSQL): Controls the verbosity level of error messages.
Values: TERSE, DEFAULT, VERBOSE.
log_min_error_statement (PostgreSQL/MySQL): Specifies the minimum error severity level for logging.
Values: ERROR, WARNING, NOTICE, etc.
log_output (MySQL): Specifies the log destination. Can be set to FILE or TABLE.
To enable error logging, modify your Amazon RDS parameter group and ensure error logging is activated.
b. General Logs
General logs help track queries, connections, and disconnections. These logs can be vital for auditing and troubleshooting performance issues.
Key parameter for general logs:
log_statement: Logs SQL statements in PostgreSQL or MySQL.
Values: none, ddl, mod, all.
Example: Set log_statement = ‘all’ to capture all SQL queries.
![]()
c. Slow Query Logs
Slow query logs track queries that exceed a certain duration. This is particularly helpful in identifying performance bottlenecks.
Key parameters:
log_min_duration_statement: Logs queries that take longer than a defined threshold (in milliseconds).
For PostgreSQL and MySQL, set the threshold to a reasonable time, such as 1000 ms for queries that run longer than 1 second.
![]()
d. Access Logs
Access logs help you monitor who is connecting to your database. This is important for detecting unauthorized access or ensuring only authorized users interact with the database.
Key parameters:
log_connections: Set this to 1 to log every incoming connection.
log_disconnections: Set this to 1 to log each disconnection event.
![]()
e. Audit Logs
Audit logs are crucial for monitoring who accessed the database, what actions were performed, and when. These logs are vital for compliance, security monitoring, and troubleshooting.
You can enable database auditing for Amazon RDS by configuring the Amazon CloudWatch logs export for Amazon RDS and leveraging PostgreSQL’s or MySQL’s audit capabilities.
How to Enable Audit Logs in Amazon RDS:
- Enable Amazon CloudWatch Logs: In your Amazon RDS instance’s settings, enable log exports to CloudWatch.
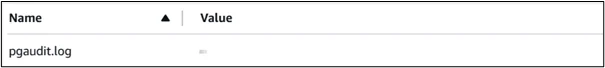
- Enable pgaudit extension: Set parameter shared_preload_libraries to include pg_stat_statements, pgaudit.
- Use pg_audit for PostgreSQL: PostgreSQL supports pg_audit for logging detailed user actions, including SQL commands and session details.
Example: Set pgaudit.log = ‘read, write’ to log all user activities.
Audit logs capture:
- Who performed the action.
- When the action was performed.
- What query was executed, including any parameterized values.
Enabling Logging for Amazon Redshift
Amazon Redshift offers robust logging options that can be configured to track query performance, user activities, and errors. Here’s how you can enable logs for Amazon Redshift:
a. User Activity Logs
User activity logs track every SQL statement executed, including queries, connections, and disconnections.
To enable user activity logs:
Go to the Redshift console and modify the parameter group to enable user activity logs.
Set parameters like:
enable_user_activity_logging: Set to true.
log_statement: Set to ‘all’, ddl, or mod to track various types of statements.
b. Query and Performance Logs
Amazon Redshift logs query execution times, durations, rows returned, and other performance metrics. This data is crucial for identifying slow or resource-intensive queries.
Enable query logging:
enable_query_logging: Set to true to start logging queries.
log_duration: Set to true to log the duration for each query.
c. Error Logs
Amazon Redshift captures errors related to query failures, system issues, or resource limitations. Enabling error logs helps you diagnose problems quickly.
To enable error logging:
log_errors: Set to true in the Redshift parameter group.
d. Audit Logs
Audit logs in Amazon Redshift are essential for tracking who performs actions on the database and what queries are being executed.
For Amazon Redshift, audit logs track:
User actions: Who ran the query and when.
SQL statements: Full details of the executed SQL query.
Audit logs can be enabled by configuring the following:
Amazon CloudWatch Logs Export: Enable Amazon CloudWatch log export for user activity, query, and error logs.
e. Amazon CloudWatch Integration for Redshift Logs
Like Amazon RDS, Amazon Redshift can send logs to Amazon CloudWatch for centralized monitoring and further analysis. Set up Amazon CloudWatch log exports in the Amazon Redshift console to send logs to Amazon CloudWatch Logs.

Best Practices for Enabling Logs
- Limit the amount of data: Be mindful of the log verbosity. Enabling ‘all’ logging in highly active environments might overwhelm your log storage and lead to performance issues.
- Set up automated alerts: Use Amazon CloudWatch Alarms based on log data to get notified of critical events, such as slow queries or high error rates.
- Review logs regularly: Check your logs for performance bottlenecks or potential security threats. Set up automated log rotation to avoid filling up storage.
Conclusion
Logging is an essential practice for maintaining the health, performance, and security of your Amazon RDS and Amazon Redshift instances. You can gain deep insights into database performance, user activities, and troubleshooting issues by enabling key logs like error logs, general logs, audit logs, and slow query logs. Moreover, integrating these logs with Amazon CloudWatch for centralized monitoring will allow for easier management and quicker identification of issues.
You can optimize your database environments while ensuring security and compliance by following best practices for logging, configuring audit logs, and enabling real-time monitoring with Amazon CloudWatch integration.
Drop a query if you have any questions regarding Amazon RDS or Amazon Redshift and we will get back to you quickly.
Empowering organizations to become ‘data driven’ enterprises with our Cloud experts.
- Reduced infrastructure costs
- Timely data-driven decisions
About CloudThat
FAQs
1. How can I enable audit logs in Amazon RDS?
ANS: – You can enable audit logs in Amazon RDS by configuring the pg_audit extension for PostgreSQL or using the MySQL Enterprise Audit Plugin for MySQL. Also, it enables log exports to Amazon CloudWatch for centralized log management.
2. Can I capture slow query logs in Amazon Redshift?
ANS: – Yes, you can capture slow query logs in Amazon Redshift by enabling query logging and setting the log_duration parameter to true in the parameter group. The slow queries will be logged for further optimization.
3. How do I configure Amazon Redshift to log user activity?
ANS: – To log user activity in Amazon Redshift, enable user activity logging in the parameter group and set log_statement to ‘all’ to capture all SQL queries executed by users.

WRITTEN BY Daneshwari Mathapati
Daneshwari works as a Data Engineer at CloudThat. She specializes in building scalable data pipelines and architectures using tools like Python, SQL, Apache Spark, and AWS. She is proficient in working with tools and technologies such as Python, SQL, and cloud platforms like AWS. She has a strong understanding of data warehousing, ETL processes, and big data technologies. Her focus lies in ensuring efficient data processing, transformation, and storage to enable insightful analytics.


Comments