

 Login
Login

 May 25, 2026
|
Voiced by Amazon Polly |
Introduction
Observability has always been a foundation of production systems. Tools like Prometheus, Grafana, and Amazon CloudWatch help engineers answer critical questions: Is the system healthy? Where is the failure? What changed?
Recently, AWS introduced AWS DevOps Agent, an autonomous investigation agent currently in preview. Unlike traditional tools that focus on collecting and visualizing telemetry, this agent focuses on analyzing operational signals and organizing incident investigations.
This naturally raises an important question:
Will the AWS DevOps Agent replace traditional observability tools?
The short answer is no. But it does change how those tools are used.
Pioneers in Cloud Consulting & Migration Services
- Reduced infrastructural costs
- Accelerated application deployment
The Role of Traditional Observability Tools
A typical observability stack includes:
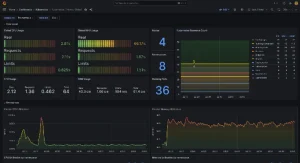
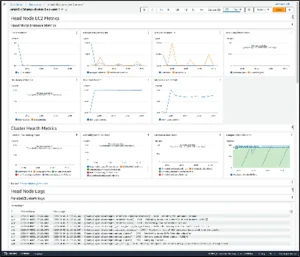
- Prometheus collects metrics. This is the foundation. Without metrics, there is nothing to monitor or investigate.
- Alertmanager sends alerts when a defined threshold is crossed. This is how engineers know there is a problem.
- Grafana helps visualize those metrics. Dashboards make it easier to understand system behavior.
- Amazon CloudWatch provides similar capabilities within AWS, including metrics, monitoring, and alerting.
Using these tools, engineers can clearly see what is happening inside the system.
But understanding why it is happening often requires deeper investigation.
Incident Workflow Comparison
Traditional workflow
Let’s take a common example. An alert triggers because the application error rate suddenly increases.
At this point, the investigation usually starts manually.
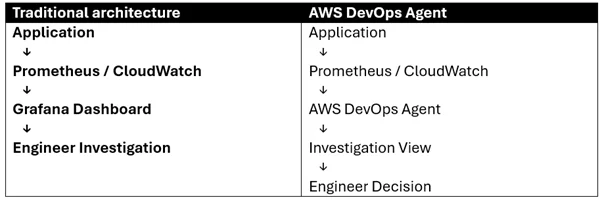
Engineers open Grafana dashboards to check system metrics. They review Prometheus data, examine application logs, and review recent deployments. They try to correlate the timing of the deployment with the increase in errors.
This process works well, but it requires manual effort to connect everything together.
With AWS DevOps Agent
With the AWS DevOps Agent connected to the environment, the starting point is still the same. An alert triggers.
But instead of manually jumping between multiple tools, the agent gathers the related metrics, logs, deployment events, and service relationships and presents them in a single investigation timeline.
Engineers can review this investigation view and decide on an action.
The engineer still makes the decision. The difference is that the investigation context is already organized.
Key difference
Traditional observability tools act as the source of telemetry.
AWS DevOps Agent acts as a layer that helps organize and connect the telemetry for investigation.
An important thing to understand is that the agent depends on these existing tools. Without Prometheus, Amazon CloudWatch, or similar systems, there would be no operational data to analyze.
Architecture Workflow Comparison
What This Means for DevOps Teams?
AWS DevOps Agent is not replacing the observability stack. It is extending it.
Each tool continues to do what it was designed for:
- Prometheus collects metrics
- Grafana visualizes system behavior
- Alertmanager sends alerts
- AWS DevOps Agent helps organize the investigation context
This keeps the foundation the same while adding another layer to help during incidents.
Evolution of Observability
Observability has gradually evolved.
It started with basic monitoring.
Then came dashboards and alerting.
Then, integrated observability platforms that combined metrics, logs, and traces.
Now, tools like AWS DevOps Agent are introducing an investigation support layer.
Each step builds on the previous one. None of the previous layers disappears.
Conclusion
AWS DevOps Agent does not replace traditional observability tools like Prometheus, Grafana, or Amazon CloudWatch.
These tools remain essential because they collect and visualize the telemetry that engineers rely on every day.
Observability tools remain the source of truth.
The agent adds context around that data.
Drop a query if you have any questions regarding AWS DevOps Agent and we will get back to you quickly.
Making IT Networks Enterprise-ready – Cloud Management Services
- Accelerated cloud migration
- End-to-end view of the cloud environment
About CloudThat
FAQs
1. Is AWS DevOps Agent a monitoring tool?
ANS: – No. It does not collect metrics. It uses existing monitoring tools.
2. Do I still need Prometheus and Grafana?
ANS: – Yes. They provide the telemetry required for investigation.
3. Does it replace dashboards?
ANS: – No. Dashboards are still used to visualize metrics.


WRITTEN BY Gokulraj G
Gokulraj G works as a Research Associate at CloudThat, with hands-on experience in automating infrastructure, managing cloud environments, and optimizing deployment pipelines. He is certified as an AWS Solutions Architect – Associate and a Terraform Associate, which supports his ability to design scalable cloud systems and manage infrastructure as code effectively. His day-to-day work involves tools like Kubernetes, Docker, and CI/CD platforms, all focused on building reliable and efficient systems.


 PREV
PREV


Comments