

 Login
Login

 June 19, 2026
|
Voiced by Amazon Polly |
Generative AI looks very simple from the outside. You type a prompt, you get a response, done.
But the moment you put this into real-world use, things start to get unpredictable.
- Responses suddenly slow down
- Some requests fail
- Costs increase, and you’re not sure why
And the biggest issue?
You don’t know what’s happening inside the system.
That’s exactly why GenAI observability becomes important.
Start Learning In-Demand Tech Skills with Expert-Led Training
- Industry-Authorized Curriculum
- Expert-led Training
Why Observability Matters
Let’s say you’ve built a GenAI assistant using Amazon Bedrock.
During testing, everything works perfectly.
Then real users come in:
- 10 users – smooth
- 50 users – still fine
- 100 users – latency starts increasing
Now questions start popping up:
- Are we hitting limits?
- Is the model slow?
- Are we consuming too many tokens?
- Is traffic too high at certain times?
Without visibility, you’re just guessing.
With GenAI observability, you can see what’s going on and take action.
This is where Amazon Bedrock monitoring with CloudWatch becomes really useful.
How the Observability Flow Works
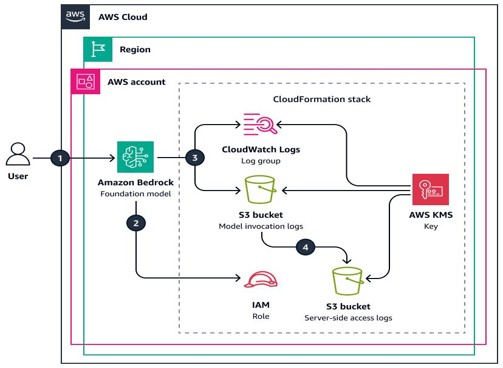
This architecture shows how Amazon Bedrock captures model invocation details such as requests, responses, latency, and token usage, and sends them to monitoring destinations like CloudWatch Logs and Amazon S3 for analysis.
Source: Monitor application activity by using CloudWatch Logs Insights – AWS Prescriptive Guidance
This screenshot illustrates how CloudWatch Logs Insights helps analyze Bedrock invocation logs, making it easier to identify errors, monitor latency, and understand usage patterns through log queries.
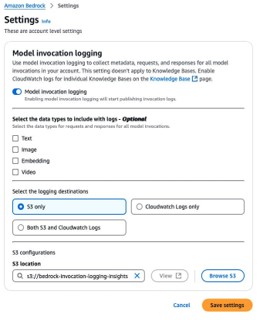
Fig 3: Configuring Bedrock model logging for monitoring and analysis.
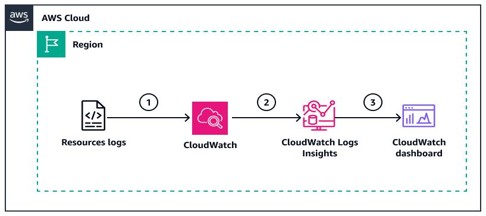
Let’s simplify this flow:
- Your application sends a prompt to Bedrock
- Bedrock processes it and generates a response
- Behind the scenes, it logs:
- latency
- token usage
- errors
- These logs are sent to CloudWatch
- You analyze them using CloudWatch Logs Insights
Simple flow but very powerful.
If you want to understand how logging works in detail, you can check
What you should monitor
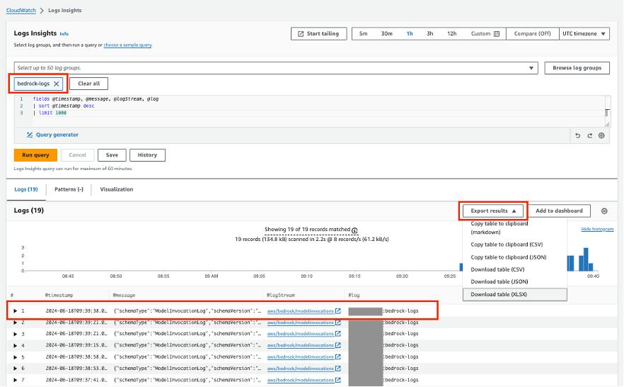
Fig 4: Logs Insights helps analyze Bedrock logs for performance and errors.
Together, Bedrock invocation logging and CloudWatch Logs Insights provide end-to-end visibility into GenAI application performance, helping teams monitor system health, troubleshoot issues, and optimize usage.
This is where most people get confused.
They open logs and don’t know what to focus on.
Let’s break it down in a practical way.
- Latency (User Experience Indicator)
- How long does the model take to respond?
- Even small delays can affect user experience
If latency increases gradually, it’s usually a sign of:
- higher load
- complex prompts
- or model limitations
- Errors (Especially Throttling)
When too many requests hit the system:
You start seeing throttling errors
This tells you:
- You’ve crossed limits
- The system needs scaling or tuning
This is often the first sign that your system is under stress.
- Request Volume (Traffic Behavior)
This helps you understand:
- When traffic peaks
- When the system is idle
- Usage patterns across time
Very useful for planning scaling strategies.
- Token Usage (Cost Driver)
This is where things directly connect to money.
- More tokens = higher cost
- Longer prompts = more tokens
- Larger responses = more tokens
Tracking this helps you:
- Estimate cost per request
- Optimize prompts
- Avoid unnecessary usage
This is where GenAI logging becomes powerful; it connects system behavior with cost.
From Logs to Insights
Using CloudWatch Logs Insights, you can:
- Detect throttling issues
- Find high-latency requests
- Track requests per minute
- Calculate total token usage
Instead of manually reading logs, you query them and extract meaningful insights.
From Insights to Action
This is where observability really proves its value.
Once you understand the system, you can:
- Optimize prompts to reduce token usage
- Adjust request rates to avoid throttling
- Choose models that perform better
- Monitor system health continuously
Now, your system is no longer a black box.
In real-world scenarios, this is where teams begin to see the impact of observability. These practices are often covered in structured learning programs such as AWS Generative AI courses, where the focus is not only on building GenAI applications, but also on monitoring and improving them in production environments.
How I Explain This in Training
I usually keep it simple:
“GenAI without observability is like driving a car without a dashboard.”
You’re moving…
But you don’t know:
- your speed
- your fuel level
- or if something is about to fail
That’s risky.
Reliable GenAI Operations
GenAI observability is critical for production systems. Amazon Bedrock monitoring provides visibility into performance and usage; CloudWatch Logs Insights converts logs into insights; and GenAI logging connects performance to cost.
Building a GenAI application is easy. Running it efficiently at scale, that’s where the real challenge begins.
Without observability, you react to problems,
With observability, you prevent them.
And that’s what separates a simple demo from a production-ready system.
And that’s what makes GenAI systems reliable at scale.
Upskill Your Teams with Enterprise-Ready Tech Training Programs
- Team-wide Customizable Programs
- Measurable Business Outcomes
About CloudThat

WRITTEN BY Priya Kanere
Priya Kanere is an AWS Subject Matter Expert and Champion AWS Authorized Instructor at CloudThat, specializing in cloud technologies, Python, data analytics, machine learning and generative AI. With extensive experience in training and mentoring, she has trained over 3,000 professionals to upskill in emerging technologies. Known for simplifying complex concepts through hands-on teaching and connecting theory with real-world applications, she brings deep technical knowledge and practical insights into every learning experience. Priya’s passion for empowering learners reflects in her unique approach to learning and development.


Comments