

 Login
Login- Consulting
- Training
- Partners
- About Us
x
AWS, Cloud Computing, News, Tutorials
 5 Mins Read

 August 5, 2014
In the recently organized AWS Summit in New York, a new extension service to CloudWatch called CloudWatch Logs has been added to the AWS services catalog. Earlierly CloudWatch was only monitoring resource utilization so to monitor application level logs we have to opt for third party tools. With CloudWatch Log service, one can upload and monitor various kinds of log files and even filter the logs for particular pattern which could help resolve various production issues like an invalid user trying to login to your application, a 404 page not found error or a bot attempting a denial-of-service-attack. So now, along with monitoring many other AWS services like EBS, EC2, RDS etc. , CloudWatch can monitor and store application logs, system logs, webserver logs and other custom logs. By setting alarm on these metrics, one can also get notified about app/webserver level issues and can take necessary actions with least delay.
There are already some services like Splunk, Loggly and Logstash which monitor the logs and provide custom detailed reports. CloudWatch Logs seems pretty basic at this point but one wouldn’t be surprised if Amazon adds more features soon.
What makes CloudWatch Logs more preferable over other third party tools?
Pricing For CloudWatch Logs service :
Ingested Data : The data(log file) being uploaded to CloudWatch.
Archived Data : All the data(log events) being uploaded to the CloudWatch is retained. One can specify the duration to retain the data. This data is being archived using gzip level 6 compression and stored. The storage space used for archived data is charged.
Log Agent : A Log Agent is a python script, running on an instance, which directs logs to CloudWatch.
Log events : A Log Event is an activity reported to the log file by the OS/application, along with a timestamp. Log events support only text format. Other kinds of formats will be reported as error in the agent’s log file (located at /var/logs/awslogs.log).
Log Stream : Log stream is a group of log events reported by a single source. Take the example of apache server’s access log file. It contains multiple events from the same source i.e. apache web server.
Log Group : Log Group is a group of Log Streams from multiple resource. For example, a WebServerAccessLog which reports Apache access log from three similar instances. Retention policy and Metric filters are set on Log Group level not on Log Stream level.
Metric Filter : The Metric Filters tells CloudWatch how to extract metric observations from ingested Log events and turn them in to CloudWatch metrics. For example we can create a Metric filter called “404_Error” which will filter on log events to find 404 access errors. An alarm can be created to monitor 404 errors on different servers/instances.
Retention Policy : Retention Policies determine how long events are retained. Policies are assigned to Log Groups and applied to all of the Log Streams in the group. Retention time can be set from 1 day to 10 years or one can also opt for logs to never get expired.
How to Install and configure Log Agent for Linux machine :
Steps :
Run the following command on the terminal.
|
1 |
wget https://s3.amazonaws.com/aws-cloudwatch/downloads/awslogs-agent-setup-v1.0.py |
3. Create IAM user for the instance from AWS console
Attach following policy to IAM user so that Log Agent will be able to take actions on Log service like upload the logs, List the log streams under log group, read the log events etc.
|
1 2 3 4 5 6 7 8 9 10 11 12 13 14 |
{ "Version": "2012-10-17", "Statement": [ { "Effect": "Allow", "Action": [ "logs:*" ], "Resource": [ "arn:aws:logs:us-east-1:*:*" ] } ] } |
4. Configure Agent
Run the following command to configure agent.
|
1 |
python ./awslogs-agent-setup-v1.0.py --region us-east-1 |
Provide the below parameters when prompted for –
On the completion of configuration, following details would be listed on the console. Note them down for future reference.
You can start/stop the agent and check the agent status using the following command :
|
1 2 3 |
service awslog start service awslog stop service awslog status |
Check the logs in AWS CloudWatch console.
Agent would have uploaded the logs to CloudWatch. You can go and check it at the console.


Here the log stream is shown for apache access log. By default at every 5 sec a trigger will happen to push the data to CloudWatch. One can configure this duration by changing the conf file of Log Agent.
Set retention policy for accessLog group
Go to log group and click on Never expire for the log group of your choice.

Creating a Metric Filter & CloudWatch Metric for 404 error
It is a two step process
Step 1 : Define Filter Pattern to search
Define pattern to find the error in Log files. Here we are searching for “404” in the apache access log. See the screenshot below. You can test out the pattern to filter and verify the result.

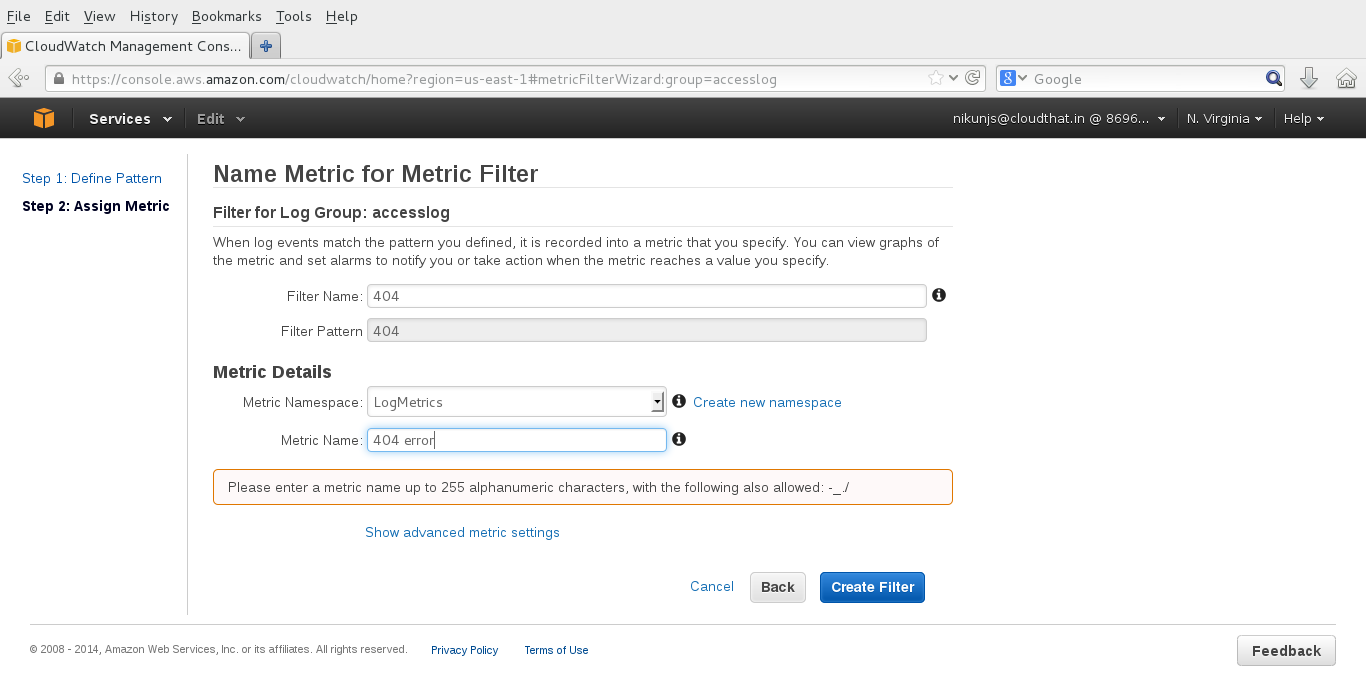
Step 2 : Assign Metric to the filter.
You can either create a new namespace, select an existing one and give the filter a name. See the screenshot below. Namespaces are container for metrics.
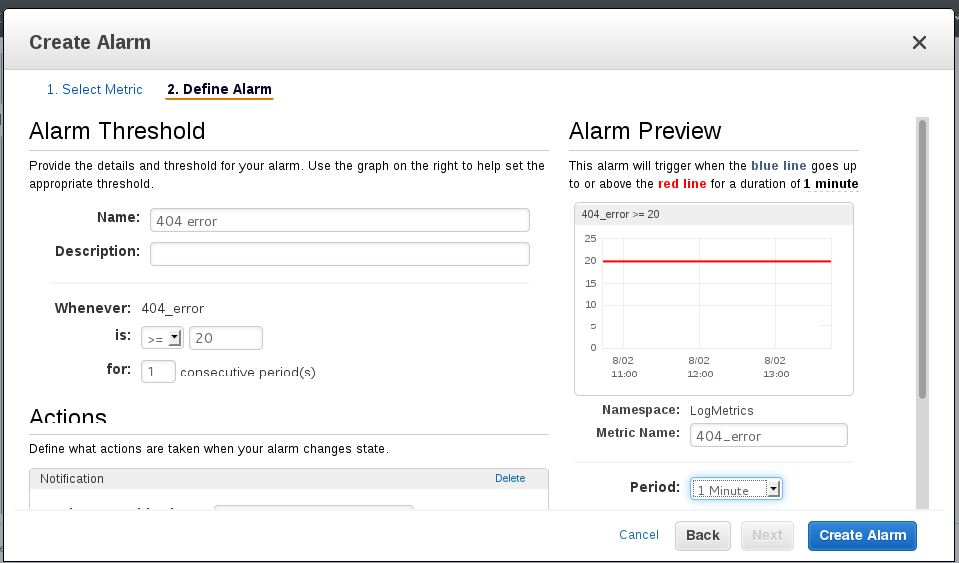
Create alarm for the metric just created.
Here we are specifying that if a 404 occurs more than 20 times in a minute, an alarm should trigger as seen in the below screenshot.
Limitations :
So far we installed and configured the log agent on EC2 instance and uploaded apache access log file to the CloudWatch. Created filter “404” on it and assigned it to CloudWatch metric to monitor. If 404 error occurs more than 20 times in a minute, an alarm will trigger and the notification-mail will be sent to the mailing list. One can configure an alarm to get triggered the event as per requirements and usage. You can configure & install agent and set CloudWatch metrics using CloudWatch API or CloudFormation or with AWS OpsWorks by writing Chef recipes also.
If you have any questions, please mention them below and I will try to answer them. Also if you like the article please share it with others.
|
Voiced by Amazon Polly |
CloudThat is a leading provider of cloud training and consulting services, empowering individuals and organizations to leverage the full potential of cloud computing. With a commitment to delivering cutting-edge expertise, CloudThat equips professionals with the skills needed to thrive in the digital era.
SHARE

AWS, Cloud Computing
By Nisarg Desai
Apr 30, 2026

AI/ML, AWS, Cloud Computing
By Akanksha Choudhary
Apr 30, 2026

AI/ML, AWS, Cloud Computing
By Sujay Adityan
Apr 30, 2026

AI/ML, AWS, Cloud Computing
By Yerraballi Suresh Kumar Reddy
Apr 30, 2026

AI/ML, AWS, Cloud Computing
By Balaji M
Apr 29, 2026

Microsoft Security
By Naved Ahmed Khan
Apr 29, 2026

Microsoft Power BI
By Mohan Krishna Kalimisetty
Apr 29, 2026

Case Study
By Anusha R
Apr 29, 2026

Case Study
By Anusha R
Apr 29, 2026

Case Study
By Anusha R
Apr 29, 2026
Our support doesn't end here. We have monthly newsletters, study guides, practice questions, and more to assist you in upgrading your cloud career. Subscribe to get them all!

Umesh
Mar 21, 2017
How do i push RDS logs to Cloudwatch.
DJ
Dec 18, 2014
How do I quickly see the lines that matches the filter I have created?