

 Login
Login
 November 15, 2022
|
Voiced by Amazon Polly |
Introduction
The best thing to analyze sorted data is using a Data Visualization tool like Power BI (desktop), where you can build dashboards, create workspaces, share with others, etc. For a better understanding of tools, you must know their essential features. In this blog, I try to show 5 useful features of the Power BI desktop platform.
Start Learning In-Demand Tech Skills with Expert-Led Training
- Industry-Authorized Curriculum
- Expert-led Training
What is a Power BI?
Power BI is a Data Visualization and Business Intelligence tool of Microsoft, that converts data from different data sources to interactive dashboards and BI reports.
You can download the latest version of Power BI using the following link –
Downloads | Microsoft Power BI
Power BI excels the greatest in the following three areas:
- Connecting data sets
- Running reports and insights
- Sharing with others
Advantages of Power BI
There are many advantages to Power BI that standard Microsoft Excel often cannot provide. Several of these benefits include:
- Memory and speed: Data can be gathered and evaluated faster.
- Seamless integration: Many analytics and reporting programs already in use can easily be integrated with Power BI. Office 365, SharePoint, Google Analytics, Salesforce, Mailchimp, and other programs are a few examples.
- Technical know-how not required: The user interface of Power BI is very familiar with other Microsoft Office programs. Simply press a button to see what happens.
- Personalized dashboards: Power BI allows you to design your dashboards, giving you a wide range of powerful customizing possibilities.
- Data security: You can safely publish reports using Power BI. You may also flexibly manage the accessibility of your data with Power BI.
Power BI lets you pull data in from multiple sources you can pull it from any data warehouse even an excel file from a website there are over sixty-nine different sources that you can pull from. When you bring that data in, you probably need a bit of cleaning i.e., getting rid of unwanted columns for a decent report. It can be done in the transform option in Power BI. Then you can create visuals according to the fields you have in your database.
This is a sample Dashboard of an excel file “walmart1.csv”:

5 Essential Features of Power BI
For a better understanding of Power BI, we must know its essential features. We are adding features for an existing Power BI dashboard here.
Table for a Created Visual
- We can get a table for the fields in which we created a visual before like, a bar graph, or pie chart. For that just click on the “Focus Mode” option in Visualizations.

- Then you will see this, click three dots on the right side, and Select Show as a Table.

- Below shown is the required Table.

Lock the Visuals from Moving
- Select the visuals which are moving from their positions with Ctrl + enter.

2. Go to the Format tab and select “Lock objects”. Now we cannot move our visuals from their positions.

Changing The Background of a Dashboard
- To change the background of the Dashboard, go to Format page > Wallpaper.

- Here, we can select the required wallpaper and click open.

3. This is how it changes when we apply wallpaper making it look even more realistic.

Align the Visual Cards
- For any randomly aligned cards to arrange properly, select them.

2. Select format > align dropdown, select align top for arranging on top of the dashboard

3. Select Distribute horizontally for equal space distribution between cards.

4. It will be aligned in the way which is shown below.

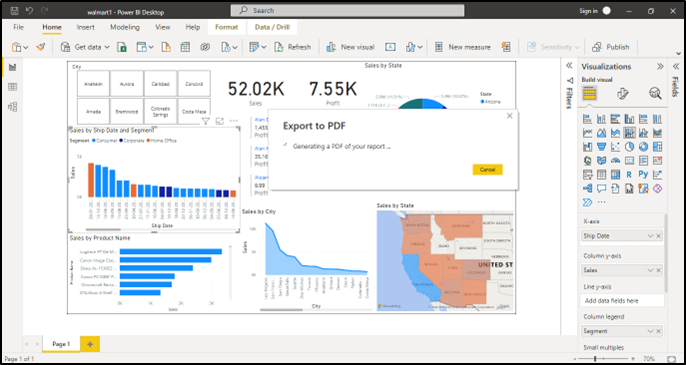
Export the Dashboard
- To export all our dashboards as PDFs, click ctrl + p on the keyboard. A pdf file will be opened.
Conclusion
Power BI is a powerful data visualization platform, it is dynamic in any field we select, and quickly reacts to change. Knowing these tricks helps make Power BI Dashboards easy. We can also use keyboard shortcuts for changing things instead of selecting the options.
Upskill Your Teams with Enterprise-Ready Tech Training Programs
- Team-wide Customizable Programs
- Measurable Business Outcomes
About CloudThat
FAQs
1. Can we print all the dashboards in a single pdf?
ANS: – Yes, using Ctrl +p we can print all existing dashboards in a single pdf file.
2. How many visualization charts can be created?
ANS: – We can create as many visualizations charts as needed.

WRITTEN BY Sandeep Cheruku


Comments