

 Login
Login


 September 7, 2026
|
Voiced by Amazon Polly |
Introduction
Modern Kubernetes environments run multiple microservices, containers, APIs, databases, and external dependencies. When an application becomes slow or starts failing, CPU and memory metrics alone may not reveal the root cause.
This is where observability becomes important.
OpenTelemetry (OTel) is an open-source, vendor-neutral observability framework for generating, collecting, processing, and exporting telemetry. It supports traces, metrics, and logs, commonly referred to as the three major observability signals.
Pioneers in Cloud Consulting & Migration Services
- Reduced infrastructural costs
- Accelerated application deployment
Why OpenTelemetry Matters in Kubernetes?
A Kubernetes application can involve multiple services during a single request.
A request may appear healthy at the Kubernetes level while still experiencing significant application latency.
OpenTelemetry helps correlate telemetry across these components so engineers can determine:
- Where latency was introduced.
- Which service generated an error.
- Which downstream dependency was affected.
- Which application or infrastructure component requires investigation.
Kubernetes itself describes observability around metrics, logs, and traces, and recommends correlating these signals to understand cluster and application behavior.
OpenTelemetry Architecture
OpenTelemetry is not an observability backend. It provides the framework and components required to generate, collect, and export telemetry.
A typical architecture is:
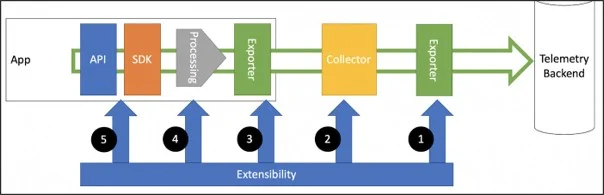
Source – Link
The Collector provides a vendor-agnostic layer for receiving, processing, and exporting telemetry.
The Three Major Telemetry Signals
- Traces
A trace represents the journey of a request through a distributed system.
A trace contains multiple spans, each representing an individual operation.
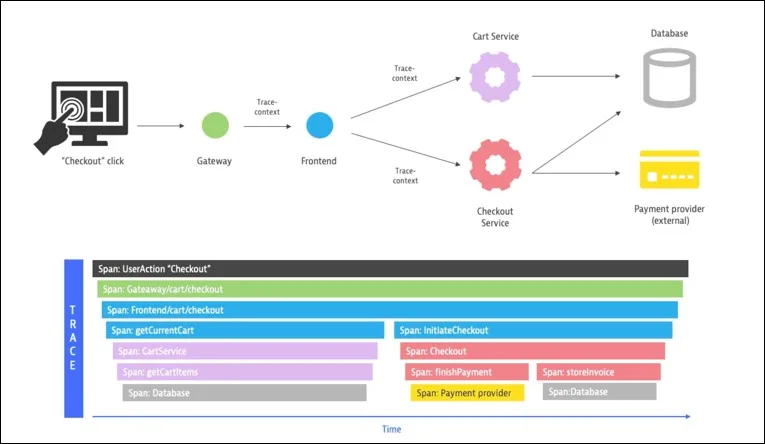
Traces are particularly useful for:
- Distributed systems.
- Latency analysis.
- Dependency analysis.
- Root-cause investigation.
- Service-to-service troubleshooting.
- Metrics
Metrics are numerical measurements collected over time.
Examples include:
- Request rate.
- Error rate.
- Request latency.
- CPU utilization.
- Memory utilization.
- Active connections.
- Queue length.
Metrics are particularly useful for dashboards, alerting, capacity planning, and identifying abnormal behavior.
OpenTelemetry also provides mechanisms for connecting metrics with other telemetry signals.
- Logs
Logs provide detailed records of application and infrastructure events.
Examples include:
- Application errors.
- Authentication events.
- Database failures.
- Configuration events.
- Startup and shutdown information.
OpenTelemetry provides a Logs API and mechanisms to process existing logs and correlate them with other telemetry.
OpenTelemetry Collector
The OpenTelemetry Collector receives, processes, and exports telemetry.
Its major pipeline components are:
- Receivers – accept telemetry.
- Processors – transform, filter, enrich, batch, or otherwise process telemetry.
- Exporters – send telemetry to destinations.
The Collector can also provide capabilities such as retries, batching, encryption, and sensitive data filtering, making it particularly useful for communication between applications and backends. (OpenTelemetry)
Deploying the Collector in Kubernetes
The Collector can be deployed using different Kubernetes workload types depending on the collection architecture.
DaemonSet
A DaemonSet can run a Collector instance on each eligible Node.
This is useful for distributed or Node-local collection.
Deployment
A Deployment can provide centralized Collector replicas.
The official OpenTelemetry Helm Chart supports Collector deployment as a DaemonSet, Deployment, or StatefulSet.
For larger environments, a combination of Node-level and gateway Collectors can be used.
Kubernetes Metadata and Correlation
Kubernetes metadata significantly improves observability.
Telemetry can be enriched with information such as:
- Cluster.
- Namespace.
- Pod.
- Container.
- Node.
- Workload.
The OpenTelemetry Kubernetes Attributes Processor can add Kubernetes metadata, such as k8s.pod.name, k8s.namespace.name, and k8s.node.name to logs, metrics, and traces.
This allows engineers to correlate telemetry across the same Kubernetes workload rather than investigating individual signals in isolation.
Distributed Tracing and Context Propagation
Distributed tracing requires the trace context to be propagated between services.
Correct propagation allows spans from different services to belong to the same trace.
If propagation is broken, engineers may see disconnected traces and lose visibility into the complete request path.
Therefore, trace propagation should be validated when implementing distributed tracing.
Production Best Practices
A production OpenTelemetry implementation should consider:
Standardization
- Use consistent service names.
- Follow OpenTelemetry semantic conventions.
- Maintain consistent resource attributes.
Performance
- Use batching where appropriate.
- Apply memory protection.
- Allocate suitable CPU and memory resources.
- Monitor Collector performance.
Cost
- Control telemetry volume.
- Review metric cardinality.
- Apply appropriate sampling.
- Define retention requirements.
Security
- Avoid collecting credentials and secrets.
- Protect sensitive application information.
- Apply organizational security and compliance requirements.
Reliability
- Avoid unnecessary single points of failure.
- Monitor Collector availability.
- Monitor dropped telemetry.
- Monitor exporter failures.
Common Mistakes
Common OpenTelemetry implementation problems include:
- Collecting excessive telemetry without a defined objective.
- Using uncontrolled high-cardinality attributes.
- Ignoring telemetry storage costs.
- Not monitoring the Collector.
- Breaking trace context propagation.
- Using inconsistent service identities.
- Exporting sensitive information.
- Deploying insufficient Collector capacity.
- Treating metrics, logs, and traces as completely separate systems.
The objective should not be to collect the maximum amount of telemetry. It should be to collect useful telemetry that supports operational decisions.
Production Observability Flow
A practical incident investigation can follow this model:
Alert
│
▼
Metrics
│
▼
Affected Workload
│
▼
Distributed Trace
│
▼
Failing Dependency
│
▼
Application Logs
│
▼
Root Cause
Metrics can identify abnormal behavior, traces can locate the problematic service or dependency, and logs can provide a detailed failure context.
This creates a structured troubleshooting workflow across the Kubernetes and application layers.
Production Architecture
A mature Kubernetes observability architecture can use multiple Collector layers:
Applications
│
▼
Node-level Collectors
│
▼
Gateway Collectors
│
┌───┼────┐
▼ ▼ ▼
Metrics Traces Logs
└───┼────┘
▼
Observability Backend
This architecture separates telemetry generation, collection, processing, and backend storage.
The exact design should depend on cluster size, telemetry volume, reliability requirements, network architecture, security requirements, and cost.
The OpenTelemetry Kubernetes documentation also provides official guidance for Collector deployment and Kubernetes-specific components.
Conclusion
OpenTelemetry provides a vendor-neutral approach to collecting metrics, logs, and traces in Kubernetes.
A well-designed implementation combines appropriate instrumentation, Collector architecture, Kubernetes metadata, correlation, security, reliability, and cost controls.
The goal is not to collect more telemetry, it is to collect the right telemetry with enough context to troubleshoot and operate production systems effectively.
Drop a query if you have any questions regarding OpenTelemetry, and we will get back to you quickly.
Empowering organizations to become ‘data driven’ enterprises with our Cloud experts.
- Reduced infrastructure costs
- Timely data-driven decisions
About CloudThat
FAQs
1. What is OpenTelemetry?
ANS: – OpenTelemetry is an open-source, vendor-neutral framework for generating, collecting, processing, and exporting telemetry such as metrics, logs, and traces.
2. Is OpenTelemetry an observability backend?
ANS: – No. OpenTelemetry is not an observability backend. Telemetry is exported to a compatible backend for storage, analysis, visualization, and alerting. (OpenTelemetry)
3. What is the OpenTelemetry Collector?
ANS: – The Collector is a vendor-neutral component that receives, processes, and exports telemetry.


WRITTEN BY Pawan Choudhary
Pawan works as a Cloud Engineer at CloudThat Technologies, specializing in scalable AWS solutions. As an AWS Certified Solutions Architect – Associate, he has expertise in cloud architecture, Infrastructure as Code (IaC), automation, and security. Pawan also has experience migrating on-premises applications to the cloud while ensuring compliance with the AWS Well-Architected Framework. Passionate about continuous learning, he enjoys solving complex infrastructure challenges and aligning solutions with business goals.


 PREV
PREV










Comments