

 Login
Login

 June 23, 2025
|
Voiced by Amazon Polly |
Overview
In today’s dynamic monitoring landscape, timely and precise alerts are crucial to maintain application uptime and performance.
In this post, we’ll explore how to configure Grafana alerts with Amazon SNS integration to ensure your teams are always in the loop.
Pioneers in Cloud Consulting & Migration Services
- Reduced infrastructural costs
- Accelerated application deployment
Integrating Grafana with Amazon SNS
Grafana’s alerting engine is highly flexible, and Amazon SNS provides a reliable messaging service to route alerts across different teams and channels. By integrating these two, you can:
- Automatically notify team members via email, SMS, or AWS Lambda.
- Scale alert delivery without worrying about infrastructure.
- Centralize and manage notifications in a single place.
Step-by-Step Guide
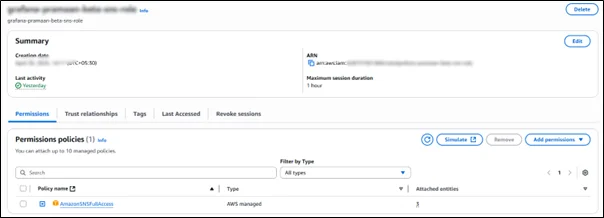
Step 1: Provide access to Grafana to use Amazon SNS:
- Creating a dedicated AWS IAM role ensures that Grafana has the required permissions to securely publish alerts to Amazon SNS.
- Using a role with AmazonSNSFullAccess avoids over-privileging Grafana’s overall access.
- Adding a trusted relationship only restricts the role’s usage to Grafana or the Amazon EC2 instance. This approach follows the principle of least privilege, reducing the risk of unintended access.
- It also enables better control, auditing, and security compliance within your AWS environment.
Step 2: Create a Service Account with name of “grafana” in using helm chart:
- Creating a dedicated service account isolates Grafana’s Kubernetes permissions from other resources.
- It ensures Grafana has only the access it needs (e.g., for alerting or dashboards), improving security.
- This also supports better auditing and tracing of Grafana’s actions within the cluster.
- Using Helm to define this ensures consistency and repeatability across deployments.
- Finally, it aligns with best practices for least privilege and Kubernetes RBAC security.
|
1 2 3 4 5 6 7 8 9 10 11 12 13 14 15 |
serviceAccount: create: true # Set to true to create a ServiceAccount; false to use an existing one. name: "" # Name of the ServiceAccount. Leave empty to use the default naming convention. nameTest: "" # (Optional) Another name for testing or alternate configurations. ## ServiceAccount labels labels: app: grafana # Example label to identify the ServiceAccount. ## ServiceAccount annotations (e.g., for attaching IAM roles in EKS). annotations: eks.amazonaws.com/role-arn: arn:aws:iam::<account-id>:role/<sns-topic-name> ## Toggle for automatically mounting the ServiceAccount token. automountServiceAccountToken: false # Disable auto-mounting of tokens by default. |
Step 3: Deploy Prometheus – helm chart in Amazon EKS Cluster
- Prometheus serves as a solution for collecting metrics and monitoring in your Amazon EKS cluster.
- It continuously scrapes metrics from Kubernetes workloads, like CPU, memory, and application data.
- Grafana uses Prometheus as a data source to build dashboards and create alert rules based on these metrics.
- Deploying Prometheus via Helm simplifies the setup with configurable charts and best-practice defaults.
- This integration ensures real-time, actionable insights to maintain cluster health and performance.
Step 4: Add Prometheus data source in Grafana
- Adding Prometheus as a data source in Grafana lets you visualize and analyze cluster and app metrics easily.
- It enables you to create dynamic dashboards using real-time data pulled directly from Prometheus.
- Grafana queries Prometheus using its query language (PromQL), providing flexibility and depth.
- This integration also forms the backbone for creating reliable, actionable alert rules in Grafana.

- Ultimately, it empowers your team with powerful observability and faster troubleshooting capabilities.
Step 5: Add alert rules
- Adding alert rules in Grafana lets you automate key metrics and threshold monitoring.
- They generate real-time notifications when conditions (like CPU usage spikes) breach defined limits.
- This proactive approach helps teams quickly identify and fix issues before they impact users.
- Alert rules leverage Prometheus data, ensuring accurate and actionable alerts.
- Ultimately, they strengthen your observability strategy and enhance system reliability.
Step 6: Add the Contact point as Amazon SNS and add the SNS ARN
- Configuring Amazon SNS as a contact point in Grafana automates the delivery of alerts to your team’s communication channels.
- By specifying the Amazon SNS Topic ARN, you ensure that alerts from Grafana reach the right recipients instantly.
- Amazon SNS scales and manages alert distribution across multiple channels (like email, SMS, AWS Lambda, etc.).

- This integration bridges Grafana’s alerting with AWS’s reliable messaging infrastructure.
- It enables faster, automated incident response, minimizing downtime and improving operational reliability.

Step 7: Edit custom template in Subject and Message
- Customizing the Subject and Message templates adds context-rich details to alerts, like instance names or severity.
- This ensures that recipients understand the issue quickly and can act fast. It improves clarity, reduces confusion, and streamlines incident response.
Subject
|
1 |
🚨{{ .CommonLabels.alertname }}{{ if .CommonLabels.pod }} - {{ .CommonLabels.pod }}{{ if .CommonLabels.reason }} - {{ .CommonLabels.reason }}{{ end }}{{ if .CommonLabels.phase }} - {{ .CommonLabels.phase }}{{ end }}{{ end }} |
Body
|
1 2 3 4 5 6 7 8 9 10 11 12 13 14 15 16 17 18 19 20 21 22 23 24 25 26 27 28 29 |
🚨 *Alert:* {{ .CommonLabels.alertname }} {{- if .CommonLabels.pod }} Pod: {{ .CommonLabels.pod }} {{- end }} {{- if .CommonLabels.namespace }} Namespace: {{ .CommonLabels.namespace }} {{- end }} {{- if .CommonLabels.node }} Node: {{ .CommonLabels.node }} {{- end }} {{- if .CommonLabels.reason }} Reason: {{ .CommonLabels.reason }} {{- end }} {{- if .CommonLabels.phase }} Phase: {{ .CommonLabels.phase }} {{- end }} {{- if .CommonLabels.job }} Job: {{ .CommonLabels.job }} {{- end }} {{- if .CommonLabels.severity }} Severity: {{ .CommonLabels.severity }} {{- end }} |
Step 8: Set default Notification timings. If needed, change accordingly
- Default notification timings ensure alerts are sent consistently and promptly for all configured rules.
- Adjusting these timings as needed prevents alert fatigue while still catching critical issues.
- It helps maintain a balance between responsiveness and operational sanity.
Conclusion
Integrating Grafana with Amazon SNS enables real-time, scalable alerting across multiple channels like email, SMS, and AWS Lambda. This ensures your teams are promptly informed of any issues, improving incident response times. It’s a reliable and efficient way to centralize alert management and maintain system uptime.
Drop a query if you have any questions regarding Amazon SNS and we will get back to you quickly.
Empowering organizations to become ‘data driven’ enterprises with our Cloud experts.
- Reduced infrastructure costs
- Timely data-driven decisions
About CloudThat
FAQs
1. Why should I use Amazon SNS for Grafana alerts instead of other notification services?
ANS: – Amazon SNS is fully managed, highly scalable, and integrates seamlessly with various endpoints (like AWS Lambda, email, and SMS). It provides reliable delivery of Grafana alerts to your team without the hassle of managing your messaging infrastructure.
2. Can I customize the alert messages sent via Amazon SNS from Grafana?
ANS: – Yes! You can create custom message templates in Grafana’s alerting system to include helpful context (like metric details, instance names, and next steps) in your Amazon SNS notifications, improving clarity and incident response times.

WRITTEN BY Saurabh Jain
Saurabh Kumar Jain is the CSA – Projects Head for DevOps and Kubernetes at CloudThat. An innovative Solutions Architect and technical leader, he is passionate about driving digital transformation across diverse industries. He specializes in designing enterprise-grade, cloud-native solutions, with deep expertise in multi-cloud platforms, Kubernetes orchestration, and AI-powered automation. Saurabh has extensive experience in architecting secure, scalable systems for sectors including oil & petroleum, financial services, e-commerce, and government organizations. He is recognized for his thought leadership in modernization strategies, GitOps workflows, and comprehensive observability implementations. In his free time, he explores emerging technologies in AI and GenAI, contributes to open-source projects, and shares knowledge through technical content and industry speaking engagements.


Comments