

 Login
Login

 June 16, 2025
|
Voiced by Amazon Polly |
Introduction
Java applications expose various performance and operational metrics through Java Management Extensions (JMX), such as memory usage, garbage collection statistics, thread count, etc. However, JMX alone isn’t ideal for the modern observability of pipelines that use Prometheus and Grafana.
This blog explores how to bridge the gap between Java-based applications and the Prometheus-Grafana ecosystem by integrating JMX metrics using the Prometheus JMX Exporter. With this setup, you can monitor your Java application’s performance, visualize trends, and detect real-time anomalies.
Pioneers in Cloud Consulting & Migration Services
- Reduced infrastructural costs
- Accelerated application deployment
Key Components and Parameters
- JMX Exporter
- A Java Agent or HTTP Server that exposes JMX metrics in Prometheus format.
- Usage Modes:
- Java Agent Mode: Attach it to your application at startup using the -javaagent JVM argument.
- Standalone HTTP Server Mode: Run the exporter as a separate process that scrapes metrics from a remote JVM.
- JMX Exporter Configuration
There should be a jmx config file in the application source code repository, and the content of the file as below:
jmx-config.yaml
|
1 2 |
rules: - pattern: ".*" |
Note: The pattern “.*” means “match all MBeans” – all available metrics exposed by the JVM will be made available to Prometheus.
Below is the Docker file, which includes the JMX config file copied to the Docker container and exposed on port 9404.
Docker file snippet related to JMX
|
1 2 3 4 5 6 7 8 |
ENV JMX_EXPORTER_PORT=9404 RUN wget -O /opt/jmx_prometheus_javaagent.jar https://github.com/prometheus/jmx_exporter/releases/download/1.2.0/jmx_prometheus_javaagent-1.2.0.jar # Copy JMX Exporter configuration COPY jmx-config.yaml /opt/jmx-config.yaml EXPOSE ${JMX_EXPORTER_PORT} |
Integrating the Java Agent in the deployment/Rollouts manifest file
Once the image is built successfully with the above JMX configurations in the source code, you can update your cmd/args section on the deployments/Rollouts of the applications.
To use the exporter, modify your JVM startup command as follows:
|
1 |
-javaagent:/opt/jmx_prometheus_javaagent.jar=9404:/opt/jmx-config.yaml |
This tells the JVM to:
- Load the agent from the specified JAR path
- Expose metrics on port 9404,
- Use the specified YAML config file to filter and structure metrics.
Prometheus Configuration
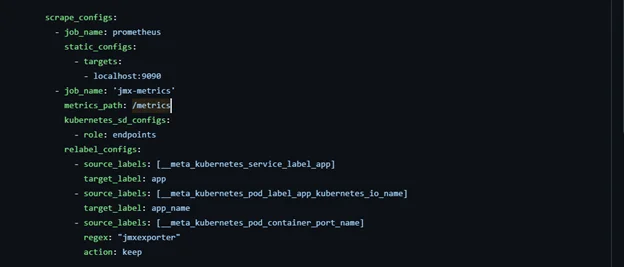
The above image is described below with detailed information.
|
1 2 3 4 |
- job_name: 'jmx-metrics' metrics_path: /metrics kubernetes_sd_configs: - role: endpoints |
- Job: jmx-metrics – A dedicated job for scraping metrics exposed by the JMX Exporter.
- metrics_path: /metrics – Specifies the HTTP path where the JMX Exporter exposes the metrics.
- kubernetes_sd_configs with role: endpoints – Uses Kubernetes service discovery to find endpoints (typically services or pods) exposing metrics.
|
1 2 3 4 5 6 7 8 |
relabel_configs: - source_labels: [__meta_kubernetes_service_label_app] target_label: app - source_labels: [__meta_kubernetes_pod_label_app_kubernetes_io_name] target_label: app_name - source_labels: [__meta_kubernetes_pod_container_port_name] regex: "jmxexporter" action: keep |
Relabeling Configuration:
- First Rule:
- Extracts the value of the Kubernetes service label app and assigns it to the app label in Prometheus.
- Second Rule:
- Maps the kubernetes.io/name pod label to a new Prometheus label called app_name.
- Third Rule:
- Filters target by checking if the container port name is jmxexporter. Only targets with this port name will be scrapped.
- action: keep – Ensures only matching targets are retained.
And on the service of the application, make sure the label consists with
app: jmx-enabled


and the port section is exposed on the right port, and the name is jmxexporter as we have mapped the label and name of the port.

Visualizing with Grafana
Once the data is retrieved, choose the right dashboard for your Grafana for the JMX integration and observe the heap metrics and other details.
Benefits of JMX Integration with Prometheus and Grafana
- Real-Time JVM Monitoring
In real-time, gain visibility into memory usage, garbage collection, thread counts, and other JVM-level metrics. - Custom Application Metrics
Expose custom MBeans from your Java application for specific business or operational insights. - Powerful Visualization with Grafana
Use Grafana’s rich dashboarding capabilities to visualize JVM metrics with historical trends, thresholds, and alerts. - Early Detection of Performance Issues
Identify memory leaks, thread deadlocks, or CPU spikes early through continuous metric scraping and alerting. - Centralized Monitoring Across Services
Prometheus enables you to monitor multiple Java services consistently from a single source. - Lightweight & Non-Intrusive
The JMX Exporter runs as a Java Agent and doesn’t require modifying the application codebase. - Alerting and Automation
Set up alerts for critical thresholds (e.g., high GC time, heap usage) to proactively handle application issues.
Conclusion
This setup helps in proactive alerting and troubleshooting, ultimately improving application reliability and performance.
Drop a query if you have any questions regarding JMX, Prometheus, Grafana and we will get back to you quickly.
Empowering organizations to become ‘data driven’ enterprises with our Cloud experts.
- Reduced infrastructure costs
- Timely data-driven decisions
About CloudThat
FAQs
1. What port should I expose for JMX Exporter in a containerized environment like Kubernetes?
ANS: – Expose the port defined for the JMX Exporter (e.g., 9404) in your container spec, and ensure the Prometheus scrape job can access it, either via service discovery or static IP.
2. Can I monitor custom MBeans using the JMX Exporter?
ANS: – Yes, you can configure the rules section in the JMX Exporter YAML to match your custom MBeans and extract their attributes as Prometheus metrics.

WRITTEN BY Ravikumar Eranna Murali
Ravikumar works a Senior DevOps Engineer at CloudThat with extensive hands-on experience in DevOps technologies and AWS cloud services. He is passionate about Kubernetes, automation, cloud infrastructure, and CI/CD pipelines, and is always eager to learn and explore emerging technologies shaping the industry. Ravikumar thrives on optimizing processes, enhancing security, and driving efficiency through automation and best practices in cloud-native environments.


Comments