

 Login
Login

 June 19, 2023
|
Voiced by Amazon Polly |
Overview
In today’s dynamic and distributed computing environments, monitoring and observability are crucial for ensuring your applications’ performance, reliability, and security. Amazon Web Services (AWS) offers a powerful solution for monitoring your Amazon Elastic Container Service (ECS) clusters: Amazon Distributed OpenTelemetry (ADOT). In this blog post, we will explore the concept of monitoring ECS clusters with ADOT, its benefits, and how it can help you gain valuable insights into your containerized applications. In this blog, we deploy a sample app and an ADOT collector as a sidecar container in an ECS cluster, and we will transfer the metrics to the AWS Managed Prometheus and traces them to the AWS X-Ray.
Pioneers in Cloud Consulting & Migration Services
- Reduced infrastructural costs
- Accelerated application deployment
AWS ADOT (Amazon Distribution for Open Telemetry)
OpenTelemetry is an open-source observability framework that provides a set of APIs, libraries, and instrumentation to enable the collection of telemetry data from software applications. It aims to standardize and simplify the collection, processing, and export of observability data such as metrics, traces, and logs.
AWS X-Ray
AWS X-Ray is a distributed tracing service that Amazon Web Services (AWS) provides. It helps developers analyze and debug applications by providing insights into the performance and behavior of distributed systems. With X-Ray, you can understand how requests flow through your applications, identify bottlenecks, and gain visibility into the overall health of your systems.
Amazon AMP (Amazon Managed Prometheus):
Amazon Managed Prometheus (AMP) is a fully managed service provided by Amazon Web Services (AWS) that offers a scalable, reliable, and highly available solution for monitoring containerized applications using the Prometheus open-source monitoring system.
AWS ECS (Elastic Container Service)
AWS ECS (Amazon Elastic Container Service) is a fully managed container orchestration service that Amazon Web Services (AWS) provides. It allows you to run and manage containers at scale, simplifying containerized applications’ deployment, scaling, and management.
Step-by-Step Procedure
- First, we will create an IAM task role for ECS Service, which provides write permission to AWS X-Ray and Amazon Managed Service for Prometheus AMP.
We can attach these roles:
|
1 |
AWSXrayWriteOnlyAccess, AmazonECSTaskExecutionRolePolicy, and AmazonPrometheusRemoteWriteAccess. |

2. Then we will create 2 subnets, one for ALB and one for ECS Container. The ALB security group allows HTTP to be inbound from all the traffic, and the AWS ECS security group allows all TCP traffic from the ALB security group as a custom source security group.


3. Next, we will create an AMP workspace from the AMP Management Console link: AMP Console Link


4. From Amazon ECS Console now, we will create an Amazon ECS Cluster with Fargate Serverless.
- Amazon ECS Cluster: An Amazon ECS (Elastic Container Service) cluster is a logical grouping of EC2 instances or AWS Fargate resources used to run and manage containerized applications. The cluster acts as the foundation for deploying and managing containers within ECS.


5. After creating an ECS cluster, we will create an ECS Task Definition. We are using the Amazon ECR public image for the image, which will create 2 containers, one with an application and one with an OpenTelemetry Collector sidecar container.
- ECR public Image link: AWS ECR Public Image Link
- AWS ECS Task Definition: In AWS ECS (Amazon Elastic Container Service), a JSON-formatted file describes how a container should be launched and run within the ECS environment. It defines various container parameters and configurations, such as the Docker image, resource requirements, networking, environment variables, logging options, and more.


- For the container port, we are giving 8080.

6. In the environment, it will automatically select AWS Fargate, and in task size, we will allocate .5 vCPU and 1GB memory. After that, we will attach the role we created in the ECS task role.

7. In the Monitoring and Logging, we will select the use log collection check box and CloudWatch as a log collector with default key value type.

8. We need to select Use trace collection and Use metric collection. Here we are using AMP as a metric collector and need to provide AMP workspace remote write endpoint.

9. After the task definition is created successfully, we can see 2 containers: the application container and the opentelemetry collector container.

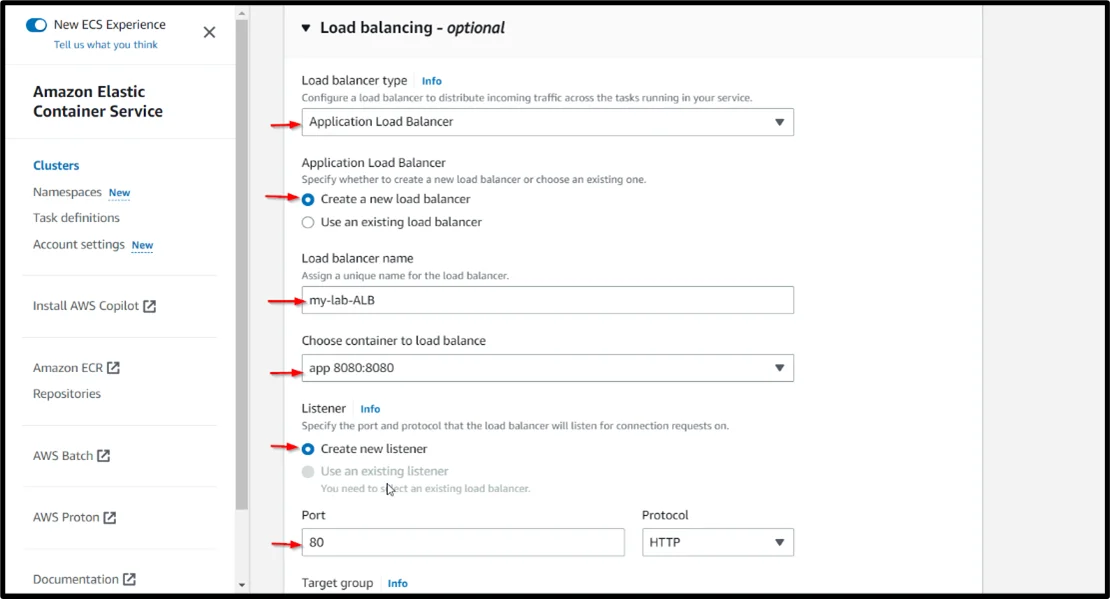
10. Next, we will create a service with ALB and Target group. Here we need to make sure that we select the ECS security group for the service, and for ALB, we need to change the security group manually because, by default, it will take the ECS security group.


11. After configuring all the settings from the above screenshots, the service will take a few minutes to be active.

12. We need to change the security group of ALB by going into the ALB management console. In the ALB security group, we need to select the security group we initially created for ALB.


13. To test the application, we should copy the ALB DNS name and generate a traffic load with the shell script.

X-Ray Service Map: AWS X-Ray Service Map is a visual representation of application components and dependencies, helping analyze and debug AWS applications.


X-Ray Traces: AWS X-Ray traces requests, collecting timing information and metadata to analyze and improve application performance.

Conclusion
Amazon ECS enables you to execute apps with various observability scenario options depending on your use cases.
In this blog, we’ve described how integrating AWS Distro for OpenTelemetry with the Amazon ECS console can make it possible to set up metrics and trace collecting without digging into AWS Distro for OpenTelemetry setups.
Making IT Networks Enterprise-ready – Cloud Management Services
- Accelerated cloud migration
- End-to-end view of the cloud environment
About CloudThat
FAQs
1. Why should I use Amazon Managed Service for Prometheus?
ANS: – Using Amazon Managed Service for Prometheus simplifies the management and operation of Prometheus, ensuring scalability, high availability, and reduced operational overhead.
2. Is it expensive to use AWS Distro for OpenTelemetry?
ANS: – The use of AWS Distro for OpenTelemetry is not expensive as it is an open-source project provided by AWS, allowing you to leverage the benefits of OpenTelemetry without additional cost.

WRITTEN BY Mohammad Zubair Saifi
Mohammad Zubair is a Research Associate with expertise in DevOps and Cloud Infrastructure. He specializes in architecting and automating scalable, secure systems using AWS, Jenkins, Git, Terraform, Ansible, Docker, and Kubernetes. Skilled in Infrastructure as Code (IaC) and CI/CD pipelines, Zubair ensures reliable application delivery and efficient operations. He also sets up monitoring stacks with Prometheus and Grafana to maintain system performance. Driven by curiosity and continuous learning, he actively contributes to implementing modern DevOps practices aligned with organizational goals.


Comments