

 Login
Login


 September 7, 2026
|
Voiced by Amazon Polly |
Overview
Effective monitoring is an essential part of running reliable applications and infrastructure. Prometheus provides a flexible way to collect numerical metrics and store them as time series data, with labels that add useful context to every measurement. Its lightweight design and pull-based collection model make it well-suited to dynamic environments where services and workloads frequently change. When combined with visualization and alerting platforms such as Grafana and Alertmanager, Prometheus can form a practical monitoring solution for cloud-native systems.
Pioneers in Cloud Consulting & Migration Services
- Reduced infrastructural costs
- Accelerated application deployment
Introduction to Prometheus
Prometheus is an open-source monitoring and alerting toolkit built around time-series metrics. Instead of relying solely on logs, teams can use metrics to understand resource usage, application behavior, traffic patterns, and service health. Prometheus periodically retrieves metric data from configured endpoints and stores it locally for querying and analysis. Exporters enable exposing information from systems and applications that do not natively provide Prometheus-formatted metrics.
The main building blocks of Prometheus include:
- Prometheus Server: Performs metric collection, stores time-series data, and evaluates queries and alerting rules.
- Exporters: Convert system, application, database, or hardware statistics into a format that Prometheus can collect.
- Alertmanager: Receives alerts generated by Prometheus and handles grouping, routing, and notification delivery.
- PromQL (Prometheus Query Language): Provides the capabilities needed to filter, calculate, aggregate, and analyze collected metrics.
Challenges
- Delayed Problem Detection: Without continuous metric collection and alerting, teams may discover performance or availability problems only after users are affected.
- Monitoring Dynamic Workloads: Modern applications can create and remove containers or services frequently, making static monitoring configurations difficult to maintain.
- Increasing Metric Volumes: Distributed applications generate large amounts of operational data, requiring an efficient approach to collecting and querying metrics.
- Application-Specific Visibility: Standard infrastructure measurements may not reveal business or application behavior, so teams often need a simple way to expose custom metrics.
- Fragmented Observability: Using separate tools without proper integration can make it difficult to connect infrastructure health, application performance, and alerts in one monitoring workflow.
Architecture
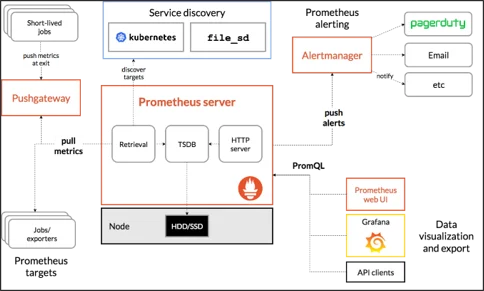
Source: Link
Key Features of Prometheus
- Time-Series Storage: Metrics are recorded with timestamps and organized into individual time series, enabling examination of how values change over time.
- PromQL: PromQL allows engineers to select metrics, apply calculations, aggregate results, and build meaningful queries for troubleshooting and monitoring dashboards.
- Label-Based Data Model: Labels add dimensions such as instance, service, environment, or job to metrics, allowing the same metric name to represent multiple monitored targets.
- Alerting Support: Prometheus can evaluate alerting rules against metric data and send resulting alerts to Alertmanager for notification management.
- Service Discovery: Prometheus can discover targets dynamically through integrations with platforms such as Kubernetes, helping monitoring adapt as workloads change.
- Cloud-Native Compatibility: Prometheus works effectively with technologies such as Kubernetes and Docker and can collect metrics from exporters and application endpoints.
- Scalable Monitoring Options: Federation and other deployment patterns allow organizations to collect or consolidate metrics across multiple Prometheus servers when monitoring requirements grow.
Integrating Prometheus with Kubernetes
Prometheus is particularly useful with Kubernetes because cluster resources are dynamic. Kubernetes service discovery allows Prometheus to identify relevant nodes, pods, and other targets without manually updating every endpoint whenever workloads change.
- Install Prometheus on Kubernetes
Helm provides a convenient way to deploy Prometheus and its supporting components. Begin by adding the Prometheus community repository:
helm repo add prometheus-community https://prometheus-community.github.io/helm-charts
helm repo update
Install the Prometheus chart:
helm install prometheus prometheus-community/prometheus
This deployment creates the required Prometheus components and provides a starting configuration for collecting Kubernetes metrics.
- Configure Service Discovery
Prometheus can use Kubernetes service discovery to automatically identify resources. A scrape configuration can define Kubernetes roles such as nodes and pods:
|
1 2 3 4 5 6 7 8 9 10 11 12 13 |
scrape_configs: - job_name: 'kubernetes-nodes' kubernetes_sd_configs: - role: node - job_name: 'kubernetes-pods' kubernetes_sd_configs: - role: pod |
These settings allow Prometheus to discover matching Kubernetes targets dynamically and collect metrics from them.
- Use Prometheus Operator
The Prometheus Operator can simplify monitoring management within Kubernetes by using Kubernetes-native resources to configure Prometheus. It is commonly deployed through the kube-prometheus-stack, which also includes components such as Grafana and Alertmanager.
helm install kube-prometheus-stack prometheus-community/kube-prometheus-stack
- Enable Metrics Exporters
Exporters provide additional visibility into Kubernetes and host-level behavior. Common examples include:
- Node Exporter: Provides metrics about CPU, memory, disk, network, and other host resources.
- Kube State Metrics: Exposes metrics that represent the state of Kubernetes objects, such as deployments, pods, and nodes.
Prometheus can scrape these endpoints and use the collected data to understand cluster health and resource usage.
- Access Prometheus and Analyze Metrics
After deployment, Prometheus can be exposed locally through port forwarding:
kubectl port-forward svc/prometheus-server 9090:80
The Prometheus interface can then be opened at http://localhost:9090, where users can run PromQL queries and inspect collected metrics.
Best practices for Prometheus:
- Choose Suitable Scrape Intervals: Avoid collecting data more frequently than necessary. Select intervals that provide useful detail without creating unnecessary resource consumption.
- Control Label Cardinality: Use labels that provide meaningful dimensions, while avoiding excessive combinations that can significantly increase the number of time series.
- Build Useful Alerts: Alerts should represent conditions that require attention and should provide enough context for engineers to investigate the issue.
- Use Dynamic Discovery: In environments such as Kubernetes, enable service discovery so newly created workloads can be monitored automatically.
- Plan for Growth: For larger environments, consider federation and an appropriate Prometheus architecture to distribute monitoring responsibilities and improve scalability.
Conclusion
Prometheus provides a practical foundation for monitoring applications and infrastructure through time-series metrics. Its label-based model, PromQL, exporters, alerting capabilities, and Kubernetes service discovery make it suitable for modern cloud-native environments. When deployed alongside tools such as Grafana and Alertmanager, it gives DevOps teams better visibility into system behavior and helps them identify potential issues before they become major service disruptions. A well-designed Prometheus setup can therefore support more proactive, reliable, and data-driven operations.
Drop a query if you have any questions regarding Prometheus, and we will get back to you quickly.
Empowering organizations to become ‘data driven’ enterprises with our Cloud experts.
- Reduced infrastructure costs
- Timely data-driven decisions
About CloudThat
FAQs
1. How does Prometheus collect metrics?
ANS: – Prometheus primarily follows a pull-based approach. It periodically contacts configured targets and retrieves metrics exposed through HTTP endpoints. The collected values are then stored as time-series data and can be queried using PromQL.
2. What are labels in Prometheus?
ANS: – Labels are key-value pairs attached to metrics that provide additional context. For example, a metric can include labels identifying the application, instance, environment, or service. This allows engineers to filter and compare metrics across different dimensions.
3. Can Prometheus generate alerts?
ANS: – Yes. Prometheus can evaluate alerting rules based on metric conditions. When an alert rule is triggered, Prometheus can send the alert to Alertmanager, which can then route notifications to configured communication channels.


WRITTEN BY Akshay Acharya
Akshay Acharya works as a Research Associate at CloudThat. He possesses strong analytical thinking and problem-solving skills, knowledge of AWS cloud services, migration, infrastructure setup, and security, as well as the ability to quickly adopt new technologies and learn.


 PREV
PREV










Comments