

 Login
Login

 June 23, 2026
|
Voiced by Amazon Polly |
Introduction
As organizations adopt cloud-native technologies, Databricks has become a leading platform for data engineering and analytics, while Kubernetes, Prometheus, and Grafana have become standard tools for infrastructure monitoring. However, separating Databricks workloads from infrastructure often creates visibility gaps and increases troubleshooting effort.
Questions such as the following become difficult to answer quickly:
- Which Databricks jobs failed in the last 24 hours?
- How many jobs are currently running?
- Are job failures related to Kubernetes resource issues?
- Which clusters are underutilized or oversized?
By integrating Databricks REST APIs with Grafana and Prometheus, organizations can build a centralized observability platform that provides end-to-end visibility into data workloads and Kubernetes infrastructure through a single dashboard. This blog explores how to achieve unified monitoring using Databricks, Grafana, Prometheus, and Kubernetes.
Pioneers in Cloud Consulting & Migration Services
- Reduced infrastructural costs
- Accelerated application deployment
Why Centralized Monitoring Matters?
In many organizations, Kubernetes infrastructure and Databricks workloads are monitored separately, making troubleshooting time-consuming and complex. A centralized monitoring approach brings infrastructure and data platform visibility into a single observability platform, enabling teams to identify and resolve issues quickly.
Key Benefits:
- Single pane of glass for infrastructure and data workloads
- Faster incident detection and root cause analysis
- Unified alerting and notifications
- Better SLA tracking and historical analysis
- Enhanced cost optimization
By consolidating monitoring in Grafana, teams can correlate Kubernetes metrics with Databricks workload performance and troubleshoot issues more efficiently.
Architecture Diagram
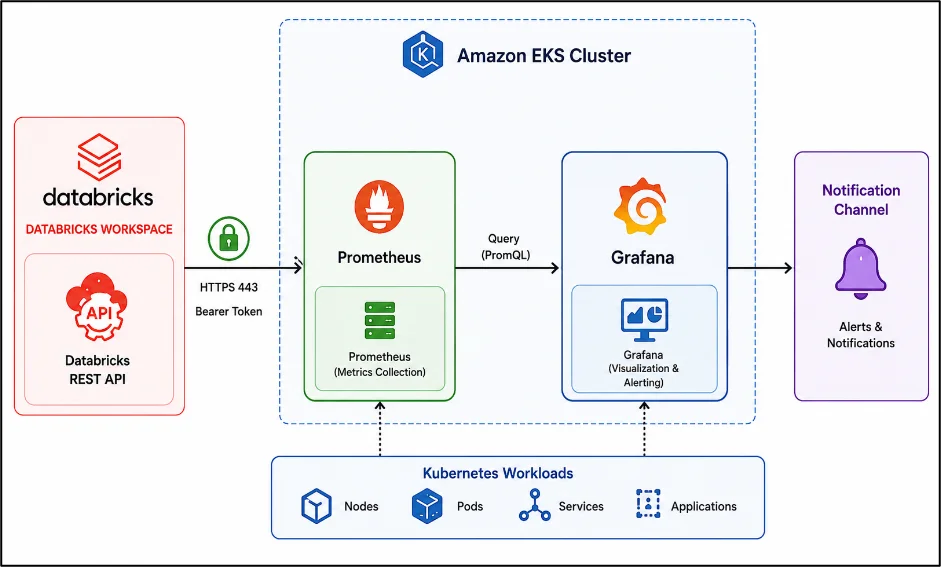
Key Concept
The architecture integrates Databricks, Prometheus, and Grafana into a unified monitoring platform. Prometheus continuously collects Kubernetes infrastructure metrics, while Grafana uses the Infinity Datasource to retrieve Databricks workload data through REST APIs. By combining infrastructure and data platform insights into a single dashboard, teams gain end-to-end visibility, centralized alerting, and faster root-cause analysis across Kubernetes and Databricks environments.
Prerequisites
Before implementing the solution, ensure the following prerequisites are in place:
- A Kubernetes cluster (Amazon EKS, Azure AKS, Google GKE, or a self-managed cluster)
- Helm installed and configured
- Access to the Kubernetes cluster using kubectl
- Permissions to deploy and manage Prometheus and Grafana
- An active Databricks workspace
- Databricks API access with the required authentication credentials (PAT or Service Principal)
Step-by-Step Guide
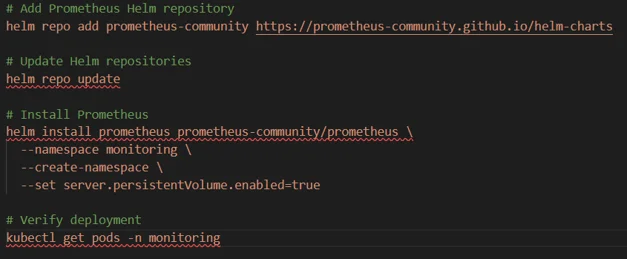
Step 1: Deploy Prometheus
Use the following commands to install Prometheus using Helm:
Prometheus will now collect:
- Node metrics
- Pod metrics
- Kubernetes events
- Resource utilization
Step 2: Deploy Grafana
Deploy Grafana as the visualization layer and configure it with the Infinity Datasource for Databricks APIs and Prometheus for Kubernetes metrics. Enable persistent storage and expose Grafana using a LoadBalancer service.
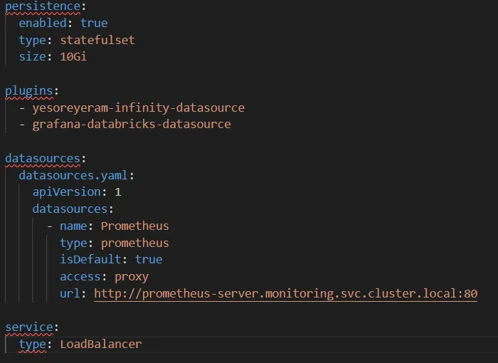
Create the grafana-values.yaml file before installing Grafana.
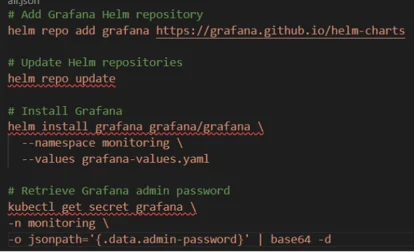
Use the following commands to install Grafana using Helm.
Step 3: Create a Databricks Access Token
To enable Grafana to access Databricks APIs, a Databricks access token must be securely generated. This token is used for authentication when Grafana queries Databricks resources such as jobs, clusters, SQL warehouses, and pipelines.
Generate a Databricks access token from the Databricks workspace.
Settings → Developer → Access Tokens
For production environments, it is recommended to avoid using Personal Access Tokens (PATs) and instead adopt enterprise-grade authentication and secret management solutions. This improves security, supports credential rotation, and reduces dependency on individual user accounts.
Recommended approaches:
- Service Principals
- OAuth Authentication
- Kubernetes Secrets
- AWS Secrets Manager
- External Secrets Operator
Step 4: Configure the Infinity Datasource
Configure the Infinity Datasource using the following settings:
- Navigate to Connections → Data Sources
- Click Add Data Source
- Select Infinity Datasource
- Enter the datasource name as Databricks API
- Choose Bearer Token as the authentication method
- Provide the generated Databricks Access Token
- Add the Databricks workspace URL under Allowed Host https://<workspace>.cloud.databricks.com
- Click Save & Test to validate the connection
Step 5: Build the Databricks Jobs Dashboard
After configuring the Databricks datasource, create dashboards to monitor job executions, failures, running jobs, and execution history.
Panel 1: Total Job Runs
Displays the total number of jobs executed within the selected time range.
Note:
- API: /api/2.0/jobs/runs/list?limit=100&expand_tasks=true
- Root Selector: $.runs
- Visualization: Stat Panel
Panel 2: Failed Jobs
Highlights failed job executions for quick issue identification.
Note:
- Filter: state.result_state = FAILED
- Visualization: Stat Panel
- Threshold: Red
Panel 3: Running Jobs
Shows currently active Databricks jobs.
Note:
- API: /api/2.0/jobs/runs/list?limit=50&active_only=true
- Visualization: Stat Panel or Table
Panel 4: Job Status Distribution
Provides a breakdown of job execution states.
Note:
- Group By: state.result_state
- Aggregation: Count
- Visualization: Pie Chart or Bar Gauge
- States: Success, Failed, Running, Cancelled
Panel 5: Job Execution History
Displays detailed execution information for troubleshooting and analysis.
Display Fields:
- Job Name
- Start Time
- End Time
- Duration
- Result State
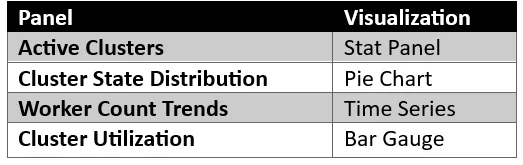
Step 6: Monitor Databricks Clusters
In addition to job monitoring, tracking Databricks cluster health and utilization is essential for maintaining performance and optimizing costs. By monitoring cluster activity, teams can identify underutilized resources, scaling patterns, and potential performance bottlenecks.
Note: Use the following API endpoint to retrieve cluster information:
- API Endpoint: /api/2.0/clusters/list
Key Metrics to Monitor:
- Running Clusters
- Terminated Clusters
- Cluster State
- Worker Count
- Autoscaling Activity
Step 7: Monitor SQL Warehouses
Use the following API endpoint to retrieve SQL Warehouse information:
- API Endpoint: /api/2.0/sql/warehouses
Key Metrics to Monitor:
- Warehouse State
- Running Queries
- Concurrent Sessions
- Query Execution Time
- Warehouse Availability
Summary
This solution leverages Prometheus to collect Kubernetes infrastructure metrics and Grafana to provide a centralized visualization platform. The Infinity Datasource Plugin enables Grafana to integrate directly with Databricks REST APIs, allowing teams to monitor Databricks jobs, clusters, and SQL warehouses alongside Kubernetes workloads from a single dashboard. Grafana Alerting provides centralized notifications for critical events, while Service Principals or Personal Access Tokens (PATs) ensure secure authentication and API access. Together, these components create a unified observability platform for infrastructure and data workloads.
Conclusion
Organizations do not need Databricks Enterprise monitoring capabilities to gain comprehensive visibility into their data platform. By combining Grafana, Prometheus, Kubernetes, and the Databricks REST APIs, teams can build a centralized observability solution that monitors jobs, clusters, SQL warehouses, and infrastructure from a single dashboard.
This approach leverages existing monitoring investments, reduces operational complexity, enables proactive alerting, and provides valuable insights into performance, reliability, and cost optimization. For DevOps, SRE, Platform Engineering, and Data Engineering teams, it creates a true single pane of glass for both infrastructure and data workloads.
Drop a query if you have any questions regarding Grafana, and we will get back to you quickly.
Making IT Networks Enterprise-ready – Cloud Management Services
- Accelerated cloud migration
- End-to-end view of the cloud environment
About CloudThat
FAQs
1. Do I need Databricks Enterprise Monitoring to build this solution?
ANS: – No. This solution uses Databricks REST APIs along with Grafana, Prometheus, and Kubernetes to provide comprehensive monitoring capabilities. Organizations can monitor jobs, clusters, SQL warehouses, and infrastructure metrics without requiring Databricks Enterprise monitoring features, making it a cost-effective alternative for centralized observability.
2. How secure is the integration between Grafana and Databricks?
ANS: – Grafana connects to Databricks using authenticated REST API calls. While Personal Access Tokens (PATs) can be used for initial setup, production environments should use Service Principals, OAuth authentication, and secure secret management solutions such as Kubernetes Secrets, AWS Secrets Manager, or External Secrets Operator. These approaches improve security, support credential rotation, and reduce reliance on individual user accounts.
3. Can I correlate Databricks job failures with Kubernetes infrastructure issues?
ANS: – Yes. One of the primary benefits of this architecture is unified observability. By displaying Databricks workload metrics alongside Kubernetes infrastructure metrics in Grafana, teams can quickly determine whether job failures are related to underlying infrastructure issues such as node resource exhaustion, pod restarts, storage bottlenecks, or network disruptions. This significantly reduces troubleshooting time and improves root cause analysis.

WRITTEN BY Aishwarya M
Aishwarya M works as a Cloud Solutions Architect – DevOps & Kubernetes at CloudThat. She is a proficient DevOps professional with expertise in designing scalable, secure, and automated infrastructure solutions across multi-cloud environments. Aishwarya specializes in leveraging tools like Kubernetes, Terraform, CI/CD pipelines, and monitoring stacks to streamline software delivery and ensure high system availability. She has a deep understanding of cloud-native architectures and focuses on delivering efficient, reliable, and maintainable solutions. Outside of work, Aishwarya enjoys traveling and cooking, exploring new places and cuisines while staying updated with the latest trends in cloud and DevOps technologies.


Comments