

 Login
Login

 December 3, 2025
|
Voiced by Amazon Polly |
Introduction
Professionals across various industries widely use Excel for data management, reporting, and analysis in today’s data-driven world. While Excel is wonderful for data organization, there are times when you must distribute or embed Excel content in blogs, programs, or presentations without deleting its layout. A converter from Excel to an image is useful in such cases.
The Python-powered Enhanced Excel takes this concept forward to Image Converter. It automatically converts an Excel sheet into a high-quality PNG image, preserving everything from cell borders, alignment, and text color to font and calculated values. As a result, it is far beyond a mere screenshot tool.
In this blog, we will explore how this converter works, its unique features, and how to utilize it to convert Excel sheets into visually uniform images for your projects.
Pioneers in Cloud Consulting & Migration Services
- Reduced infrastructural costs
- Accelerated application deployment
Abstraction
Essentially, this converter is an automated tool developed using Python, which utilizes the powerful OpenPyXL and Pillow (PIL) libraries.
Opening Excel workbooks, extracting data, and understanding cell formatting, including fills, fonts, and borders, are all managed by OpenPyXL.
Pillow, the modern PIL spin-off, builds images by drawing borders with lines, cells with rectangles, and cell contents with text.
The objective is to produce a flexible and accurate visual representation of a specified Excel sheet. You can render the entire sheet or only a portion of the rows and columns. Additionally, the output image can be modified for various applications, such as reporting, dashboards, and embedding in web applications.
Key Features and Functionality
The converter’s primary task is to create functions. It has several well-thought-out features that make it robust and flexible:
- Supports multiple sheets: You can provide a sheet name or allow the program to utilize the active sheet by default.
- Separation of data and formatting: It imports two versions of the workbook, one with calculated values (data_only=True) and another with formulas and formatting (data_only=False).
- Controlled rendering: It is possible to restrict rendering to a given number of rows or columns through read_rows and read_cols.
- Preservation of formatting: The tool reads and renders cell background colors, borders, alignments, and font weights (bold or regular).
- Dynamic sizing: To ensure proportional presentation, column widths and row heights are dynamically determined using Excel’s internal measures and cell contents.
The result is a crisp, high-fidelity PNG image that preserves the visual integrity of your Excel data while accurately representing it.
The Converter's Operation
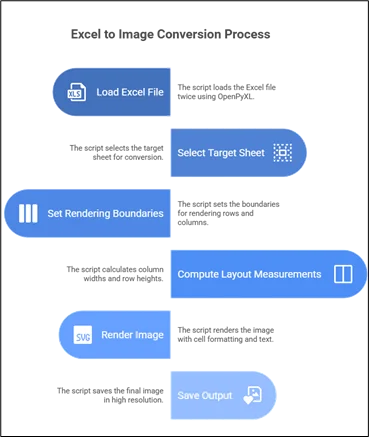
Let’s take a step-by-step look at the script’s workflow:
The script begins by using OpenPyXL to load the Excel file twice. Calculated formula values are loaded into the first worksheet (wb_values), styling details such as colors, borders, and alignments are preserved in the second worksheet (wb_format), and the target sheet, either user-defined or the active one, is selected after loading:
|
1 2 |
Wb_values = load_workbook (data_only=True, excel_file) Wb_format = load_workbook (data_only=False, excel_file) |
Step 2: Setting Rendering Boundaries
The script decides how many rows and columns to render:
|
1 2 |
eff_rows = min(sheet_rows, read_rows) if read_rows else sheet_rows eff_cols = min(sheet_cols, read_cols) if read_cols else sheet_cols |
This comes in handy when you need to render only part of a big Excel table, e.g., the top 10 rows and columns 5.
Step 3: Computing Layout Measurements
Column widths are guessed based on text length, so text won’t get truncated:
|
1 2 |
needed = text_len * 9 + 30 max_width = max(max_width, min(needed, 400)) |
Row heights are calculated similarly from Excel’s internal point values and scaled to pixels.
A pixel-perfect canvas size is then produced by adding the widths of the columns and the heights of the rows to determine the overall image size.
Remember that Excel’s internal column width ≠ pixel width it’s based on font metrics and DPI (typically ~8.43 width ≈ 64 pixels).
Step 4: Rendering the Image
After the layout is determined, a white image is initialized:
|
1 2 |
img = Image.new('RGB', (total_width, total_height), 'white') draw = ImageDraw.Draw(img) |
Per cell:
- The background color is plotted using Excel’s fill color.
- Line strokes plot borders.
- Text is plotted with alignment (left, center, or right) and font weight (regular or bold).
Even text cutting is managed nicely if the cell content is larger than its visible width, resulting in clean-looking visuals without overflowing text.
Step 5: Saving the Output
Lastly, the finished image is saved in high resolution:
|
1 |
img.save(output_file, optimize=True, dpi=(300, 300)) |
The method returns detailed data, such as image size, disk usage, and the number of rendered cells, which are useful for debugging or optimization.
Design Decisions and Optimization Tips
The design of the converter isn’t merely functional, it’s optimized carefully for performance and readability:
- Simultaneous workbook loading provides both visual accuracy and correct computed values.
- Width heuristics that are generous avoid truncating lengthy text inputs.
- Auto-detection of sophisticated formatting (such as colored fills) helps determine whether further rendering steps are necessary.
- Fallback fonts (ImageFont.load_default()) guarantee the tool’s smooth operation on systems without the Arial font installed.
The judicious application of these design principles enables this converter to handle large sheets promptly with high visual accuracy.
Real-World Uses
There are numerous real-world applications for the enhanced Excel-to-image converter:
- Systems for automated reporting: Create shareable visuals for dashboards or emails from Excel-based financial or sales information.
- Blogs and documentation: Without using screenshots, include well-formatted Excel tables in technical blog posts or articles.
- Data validation: Display Excel results programmatically in test cases or ETL process flows.
- API integration: Interoperate with Flask or FastAPI backends to produce Excel snapshots at runtime for clients.
The feature of being able to define output dimensions and maintain styling makes it suitable for both enterprise and data visualization applications.
Conclusion
The Python Enhanced Excel to Image Converter demonstrates how software development can transform a mundane task, such as capturing a screenshot of a spreadsheet, into an automated, high-quality process.
This script provides a solid foundation for converting Excel data into visually consistent files, whether you’re creating automated reports, integrating analytics into websites, or documenting workflows.
Drop a query if you have any questions regarding Python and we will get back to you quickly.
Empowering organizations to become ‘data driven’ enterprises with our Cloud experts.
- Reduced infrastructure costs
- Timely data-driven decisions
About CloudThat
FAQs
1. Can calculated numbers and Excel formulas be handled by this converter?
ANS: – Indeed. Both the source formulas and their calculated results are read by the converter. The script makes sure that the presented image contains evaluated results rather than formula expressions by loading the workbook twice, the first time with data_only=True.
2. Does it have support for conditional formatting or merged cells?
ANS: – The script does not currently support dynamic items, such as conditional formatting or merged cells. These can be supported with slight modifications through OpenPyXL’s native support for conditional formatting and merged cells.
3. How big an Excel file can this converter process?
ANS: – The converter works well with small to medium-sized workbooks (a few thousand cells or so). For extremely large files, you might want to restrict rows and columns via the read_rows and read_cols arguments to prevent using too much memory.

WRITTEN BY Akanksha Choudhary
Akanksha works as a Research Associate at CloudThat, specializing in data analysis and cloud-native solutions. She designs scalable data pipelines leveraging AWS services such as AWS Lambda, Amazon API Gateway, Amazon DynamoDB, and Amazon S3. She is skilled in Python and frontend technologies including React, HTML, CSS, and Tailwind CSS.


Comments