

 Login
Login- Consulting
- Training
- Partners
- About Us
x
AWS, Tutorials
 5 Mins Read

 August 19, 2015
What are metrics?
Metrics are used to monitor various resources in Amazon Web Services like EBS volumes, EC2 instances and RDS instances. Apart from the pre-defined metrics in AWS, sometimes monitoring is required for additional service parameters. For creating a user defined metric, AWS has introduced custom metrics in CloudWatch.
This feature can be used to store business and application metrics in Amazon CloudWatch. Also, a graph plot is generated to give a visual interpretation of the metric. Custom metrics can be setup on almost all services such as Amazon EC2 instances, AWS Billing, Autoscaling, EBS volumes and Relational Database Services. In addition, CloudWatch alarms can be set and automated actions can be configured on the basis of these metrics.
Why use Custom metrics?
Amazon Web Services provides a wide range of metrics for EBS, EC2 and RDS services. Alarms can be configured on the basis of these metrics and actions like terminating EC2 instances, restarting them or sending messages to SQS can then be taken.
Each of these services have different metrics associated with them and Cloudwatch can measure metrics provided by the hypervisor like disk-read, disk-write and disk usage for EBS and CPU Utilization, CPU credit Usage.
For instance, a user might have to take automated actions based on a particular parameter. This parameter can be the number of active users in a system which can be stored in an RDS instance. A script can be used to measure this value and if the number of users is zero for a particular time period, an alarm needs to be triggered and the EC2 instance needs to be terminated.
Use Case:
For instance, a user might have to take automated actions based on a particular parameter. This parameter can be the number of active users in a system which can be stored in an RDS instance. A script can be used to measure this value and if the number of users is zero for a particular time period, an alarm needs to be triggered and the EC2 instance needs to be terminated.
Now let us see how we can configure a custom metric based on the above use case:
Prerequisites:
In the following steps we will configure a custom metric to monitor the active sessions of a particular user using an RDS instance and create an alarm for this custom metric to terminate EC2 instance when it reaches the threshold of zero.
Creating a custom metric
The following code snippet can either be run on python interactive console or the whole code can be copied and run using it as a python script.
|
1 2 3 4 5 6 7 8 9 10 11 12 13 14 15 16 17 18 19 20 21 22 23 24 25 26 27 |
from boto.ec2.cloudwatch import connect_to_region import MySQLdb import boto.ec2.cloudwatch db=MySQLdb.connect("ravit.rdshostname.ap-northeast-1.rds.amazonaws.com","username","password","databasename") cursor=db.cursor() n=cursor.execute("select * from GetActiveSessions") n1=cursor.fetchone() s=str(n1) table=string.maketrans( '', '', ) number=s.translate(table,"(){}<>,L") numbers=int(number) reg='ap-northeast-1' conn_cw=boto.ec2.cloudwatch.connect_to_region(reg,aws_access_key_id=’your_access_key’,aws_secret_access_key=’your_secret_key’) conn_cw.put_metric_data(namespace='my_namespace',name='my_metric',value=numbers,dimensions={'InstanceId':'i-a1b2c3d4'}) |
The following code gets the active number of users in RDS running MySQL and updates the custom metric based on that value. This script can be run as a cron job to get dynamic values where for every one minute the value of the custom metric is updated.
| Parameter | Input parameter type | Description |
| namespace | string | The namespace of the alarm to tag. |
| name | list or string | The list of names to add the alarms or a string name to add a single alarm name. |
| value | int, float or list | The list or a single int value to add to the alarm. |
| dimensions | dictionary | The name-value pairs to associate with the metric.The dimensions can either be InstanceId key-value pairs or InstanceName key-value-pair. |
Note: For values like CPUUtilization, AWS/EC2 cannot be used in the namespace and name field because they are pre-defined values and cannot be overridden. These values can be accessed by using the function:
|
1 2 3 4 |
metrics=boto.ec2.cloudwatch.CloudWatchConnection(aws_access_key_id=’your_access_key’,aws_secret_access_key=’your_secret_key’).list_metrics() for metric in metrics: print metric.name +”\t”+ metric.namespace |
The above code prints a list of metric name and metric namespace values which cannot be used in the custom metric function.
How to check whether the custom metric was created:
Step 1. Navigate to CloudWatch in the AWS Management Console. A new dropdown menu called ‘custom metrics’ appears. Click on it.

Step 2. Click on the drop down menu, the newly created metric’s namespace ‘my_namespace’ is displayed, click on it.
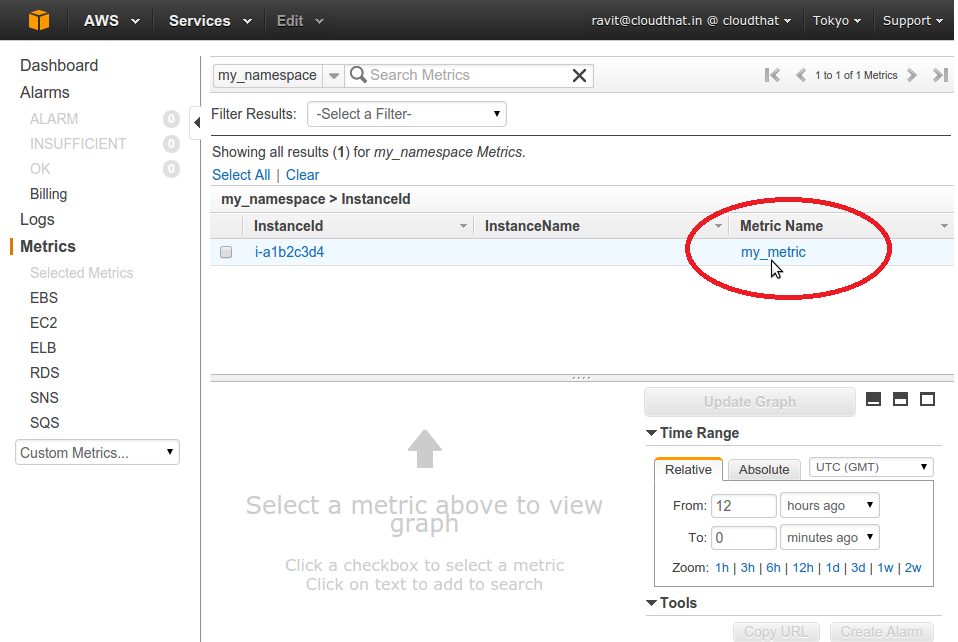
Step 3. The newly created metric ‘my_metric’ for the instance ‘i-a1b2c3d4’ can be viewed.
Creating a CloudWatch alarm for the custom metric
Now that the custom metric is created, we need to create an alarm for it. This alarm can be created using the AWS Management console or can be done using the following script:
|
1 2 3 4 5 6 7 |
from boto.ec2.cloudwatch import connect_to_region import boto.ec2.cloudwatch metric=cw.list_metrics(dimensions={'InstanceId':’i-a1b2c3d4’},metric_name='my_metric')[0] metric.create_alarm(name='my_alarm', comparison='<=', threshold=0, period=300,evaluation_periods=1, statistic='Average', alarm_actions='arn:aws:automate:ap-northeast-1:ec2:terminate') |
The following code snippet creates an alarm called ‘my_alarm’ for the custom metric. Whenever the value of the custom metric is zero for 5 minutes time period the alarm terminates the EC2 instance.
| Parameter | Input parameter type | Description |
| name | list or string | The list of names to add the alarms or a string name to add a single alarm name. |
| comparison | operators | The operator to check the custom metric values |
| threshold | int or float | The value for which the alarm should take action |
| period | int | The time period for which the alarm should take action |
| evaluation_period | int | The number of times the value has passed the threshold in order for the alarm to activate |
| statistic | string | The statistical value for the metric |
| alarm_actions | string | The arn of the action to be taken once the alarm is active. |
Note: The put metric data must actively supply the metric value in order for the alarm to be in ok state or else it will be in insufficient state.
Perform the following steps to view the alarm using the AWS Management console .
Go to AWS console and open CloudWatch and select ‘alarms’.

Using the above steps, we have created a custom metric called ‘my_metric’, gave it a static value of 10 and associated it with an EC2 instance. We also created a CloudWatch alarm called ‘my_alarm’ configured the alarm to terminate the instance if the value of metric is zero for 5 minutes. The alarm will go in insufficient state if the custom metric has a static value. The metric created should have dynamic input at a fixed time intervals so that the alarm is in ‘ok’ state. This can be achieved by using a cron job to supply dynamic values to CloudWatch.
Pricing
Limitations:
For further queries regarding creation of custom metrics, please feel free to comment below and I will be happy to answer.
|
Voiced by Amazon Polly |
CloudThat is a leading provider of cloud training and consulting services, empowering individuals and organizations to leverage the full potential of cloud computing. With a commitment to delivering cutting-edge expertise, CloudThat equips professionals with the skills needed to thrive in the digital era.
SHARE

Cloud Computing, Data Analytics
By Hridya Hari
May 8, 2026

AI/ML, AWS, Cloud Computing
By Ahmad Wani
May 8, 2026

AI/ML, AWS, Azure
By Livi Johari
May 8, 2026

AI/ML, AWS, Cloud Computing
By Sridhar Andavarapu
May 8, 2026
AWS, Cloud Computing
By Rishi Raj Saikia
May 7, 2026

AI/ML, AWS, Cloud Computing
By Akanksha Choudhary
May 7, 2026

AI/ML, AWS, Cloud Computing
By Nekkanti Bindu
May 7, 2026

AWS, Cloud Computing
By Akanksha Choudhary
May 7, 2026


Case Study
By Anusha R
May 4, 2026
Our support doesn't end here. We have monthly newsletters, study guides, practice questions, and more to assist you in upgrading your cloud career. Subscribe to get them all!

Arun
Dec 31, 2016
Hello,
Is it possible to monitor a URL with the custom cloud metrics?
Ravi Theja
Feb 16, 2017
Hi Arun,
First of all a huge thank you for reading my blog and apologies for the delayed response. the answer to your question is no we cannot monitor a URL using custom metrics, since AWS supports only metrics with numerical values.
But a workaround I can suggest is the HTTP response codes. You can create different namespaces in Metrics or different metrics such as 4xx code or 5xx codes for monitoring 404 or 500 errors and you can setup alarms based on the values you get frequently. Please let me know if you have any further queries I will be happy to answer them.
abderrahman
Jun 7, 2016
can you tell me how to cutomize metric that gather information about any running application in amazon instance using python
Ravi Theja
Jun 13, 2016
@abderrahman Yes you can.
Just get that value from the application and store it into a file or from python subprocess module.
import subprocess
application_value=subprocess.Popen(‘ls’, stdout=subprocess.PIPE)
In order to push the data to cloudwatch we can use the put metric data as described above in my blog.
from boto.ec2.cloudwatch import connect_to_region
conn_cw=boto.ec2.cloudwatch.connect_to_region(reg,aws_access_key_id=’your_access_key’,aws_secret_access_key=’your_secret_key’)
conn_cw.put_metric_data(namespace=’my_namespace’,name=’my_metric’,value=application_value,dimensions={‘InstanceId’:’i-a1b2c3d4′})